Data Integration Operational Analytics

Introduction
Monitoring Data Integration
Monitoring data integration pipelines is essential for any data warehouse or data lake. Data engineers need to understand status of data loading jobs, how many records were selected, inserted and updated, how much time data processing tasks required, whether the duration was according to expectations, and if all the required dependencies were met. This operational metadata must be available not only for the recent tasks, but also for the historical jobs.
Built-In Capabilities
Data Integration service in Oracle Cloud provides several monitoring features out-of-the-box:
-
Console - running, completed, or failed tasks can be monitored directly from the console. For pipeline tasks, you can drill down to data flows and other tasks in the pipeline and see the status of tasks in the pipeline. The console also provides the ability to see the summary of tasks within a workspace or an application.
-
Events - Data Integration emits events when a task execution starts, finishes successfully or with an error, or when a task duration exceeds expected duration. When such an event happens, you can notify users via Notifications or perform more sophisticated automation via Functions.
-
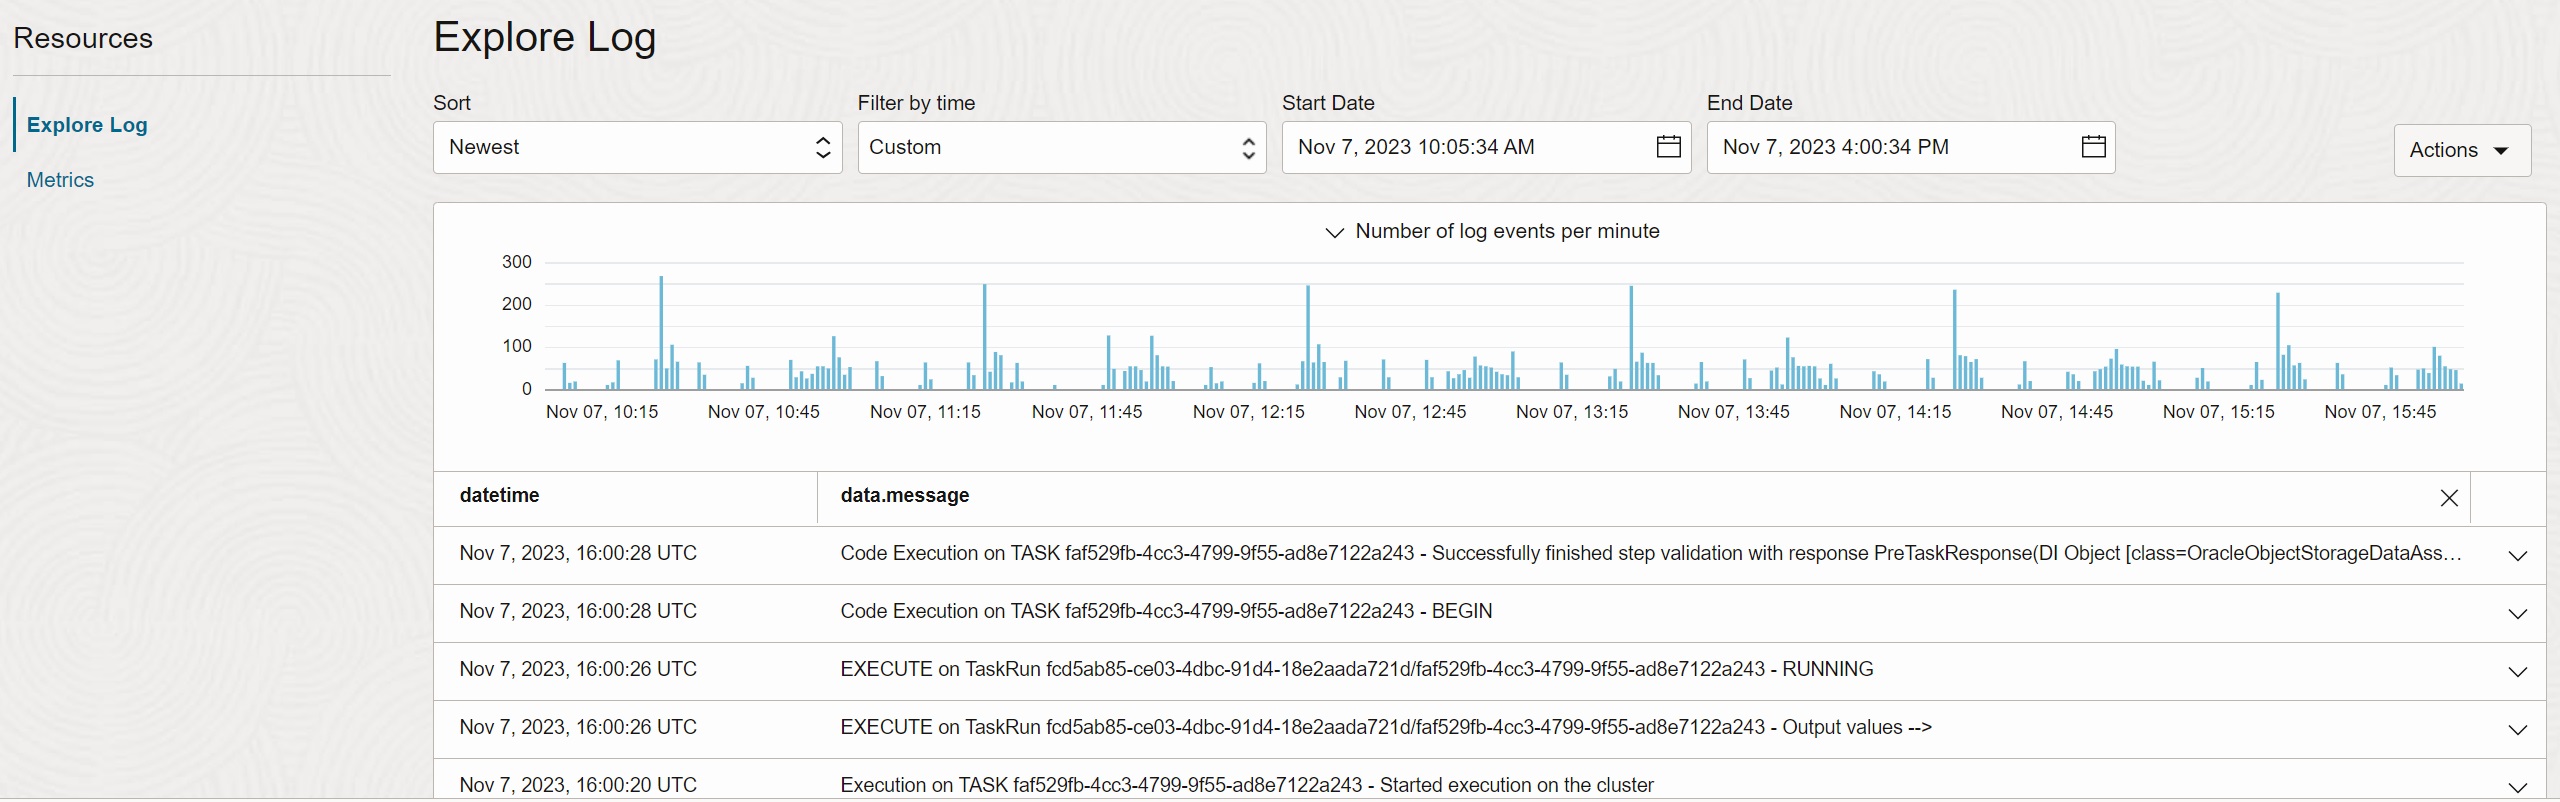
Logging - you can enable logging for a Data Integration Workspace. Once enabled, Data Integration writes information about task start time, status, input and output parameters, errors, and other events into the Logging service. You can use search to extract logs for a particular task run.
-
Monitoring - Data Integration provides several metrics to Monitoring service. You can use alarms to notify users when a metric, such as number of task runs with an error, exceeds defined threshold.
Do You Need More?
With the built-in capabilities, why would you need another tool to analyze and visualize Data Integration tasks? There are several reasons why collecting runtime metadata and analyzing them outside of Data Integration might be helpful:
-
Customized dashboards - you need operational dashboards and analytics that go beyond the capabilities offered by the Data Integration console.
-
Single pane of glass - Data Integration console shows tasks within a single workspace and an application. It does not provide single pane of glass across workspaces and applications.
-
Consumption analysis - you would like to analyze usage and consumption of Data Integration service by workspaces, applications, and tasks.
-
Enterprise job monitoring - Data Integration tasks have to be monitored together with other jobs running in the enterprise - for example, when Data Integration tasks are scheduled and executed by an enterprise job scheduler.
Use Case
Objectives
This post demonstrates how you can build analytics and visualizations that provide insights into Data Integration operations not available from the Data Integration console. I will explain the end-to-end solution, including the data extraction, pipeline, transformations, data store, and analytics.
Not only is such solution quite useful, it also shows how Oracle Cloud services can be easily configured to work together, with simple configuration and minimum programming. As the solution uses Logging as the primary data source, you could build similar analytics for many other services.
Data Extraction Approach
Operational metadata of Data Integration runs are visible in the console, they can be extracted via API, or they can be accessed via integrated services described in Built-In Capabilities.
For this post I decided to use as a data source logs written by Data Integration to the Logging service. The main benefit of this approach is simplicity and timeliness - logs are written to the Logging service automatically, in real-time, and they are accessible with minimum latency.
The downside of using Logging is the fact that the required information in logs is in the
single JSON field data.message, which has to be parsed and which is not well documented.
Also, logs contain only subset of the information available in the Data Integration
service.
Source Data
Logging service stores all service and custom logs in a uniform structure. A single log
record is a JSON document, with oracle object common to all log sources, and data
object specific to particular source. An example of Data Integration log looks like this:
{
  "data": {
    "logLevel": "INFO",
    "message": "EXECUTE on TaskRun <Task Run UUID> - TaskRun Created. Details: Task Key: <Task Key> Task Name: pipeline-usage-data-load-parallel",
    "objectId": "<Task Run UUID>",
    "opcRequestId": "<OPC Request ID>",
    "workspaceId": "<Workspace OCID>"
  },
  "id": "<Message UUID>",
  "oracle": {
    "compartmentid": "<Compartment OCID>",
    "ingestedtime": "2023-11-02T09:33:36.697Z",
    "loggroupid": "<Log Group OCID>",
    "logid": "<Log OCID>",
    "tenantid": "<Tenancy OCID>"
  },
  "source": "<Log Source OCID>",
  "specversion": "1.0",
  "time": "2023-11-02T09:33:33.922Z",
  "type": "public.log.dis.execute"
}
The message patterns with important information are:
Task Run Created:
"message": "EXECUTE on TaskRun <Task Run UUID> - TaskRun Created. Details: Task Key: <Task Key> Task Name: pipeline-usage-data-load-parallel"

Input Parameters:
"message":"EXECUTE on TaskRun <Task Run UUID> - Parameter Name= SYS.TASK_START_TIME ; Value= Thu Nov 02 09:33:32 GMT 2023"

Output Parameters:
"message":"EXECUTE on TaskRun <Task Run UUID> - SYS.STATUS = SUCCESS"
Target Data
The required information is on the level of individual task runs. For every task run we need to know when it started and finished, what was the status, how much data was read and written, and how many records were inserted or updated. For pipeline tasks, we need this information on the total pipeline level, as well as on the level of child tasks in the pipeline.
| Attribute | Description |
|---|---|
| Task Name | Design name of the task |
| Task Type | Type of the task (Pipeline, Integration, SQL, etc. |
| Task Run Name | Run name of the task |
| Task Key | Task key |
| Task Parent Name | Design name of the parent task |
| Task Parent Run Name | Run name of the parent task |
| Task Parent Key | Task key of the parent task |
| Task Run Status | Status of the run |
| Task Run Start Time | Start timestamp |
| Task Run End Time | End timestamp |
| Task Run Duration | Duration of the task |
| Task Run Read Bytes | Read bytes |
| Task Run Written Bytes | Written bytes |
| Task Run No Of Inserts | Number of inserted records |
| Task Run No Of Updates | Number of updated records |
Pipeline Design
The data pipeline is depicted below.
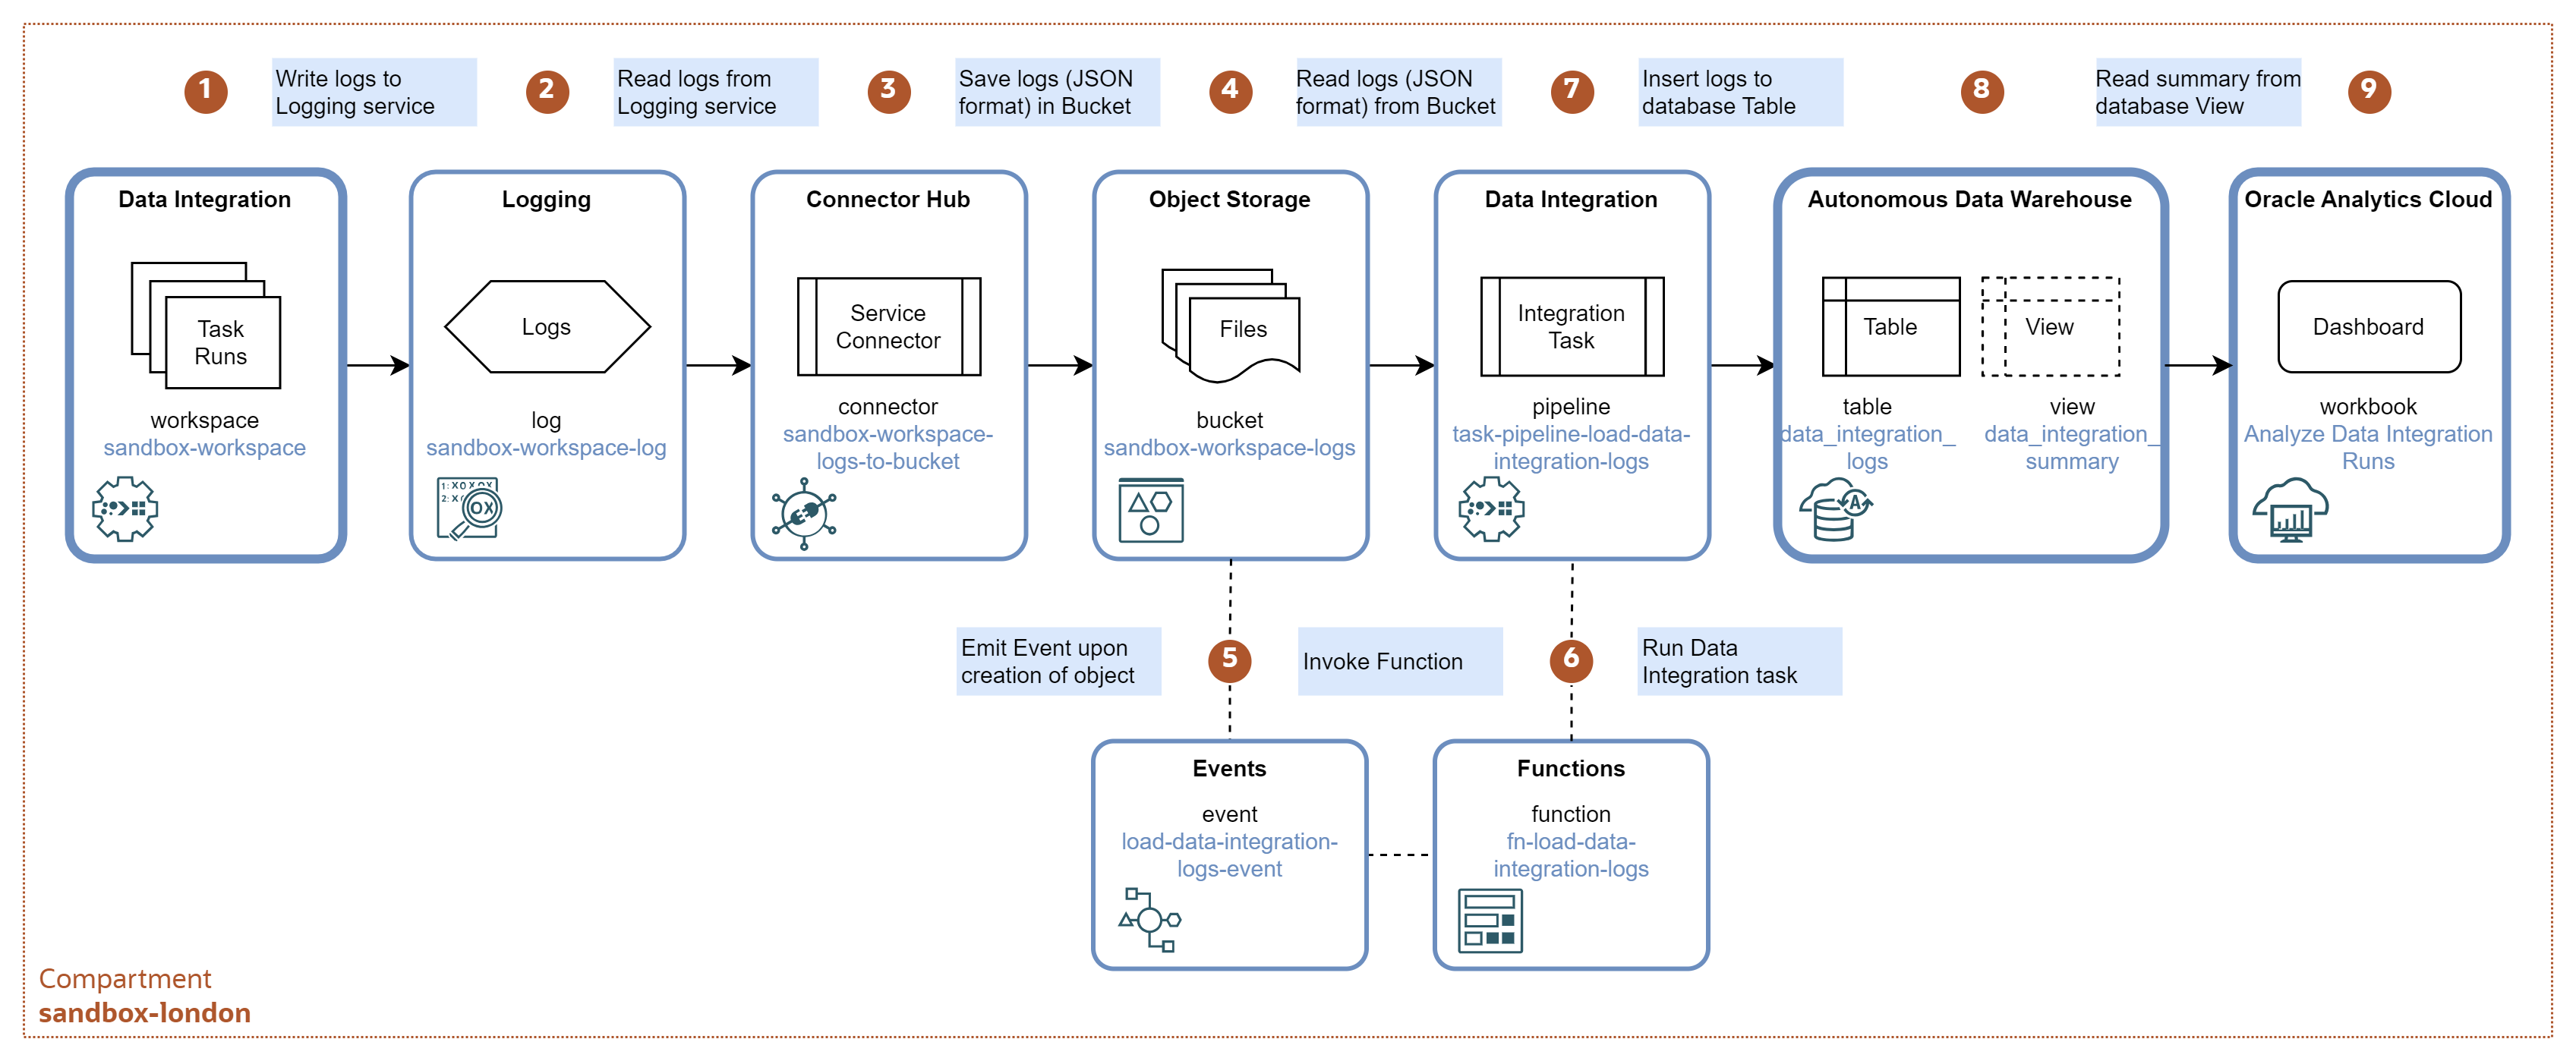
-
Data Integration tasks are designed and deployed in the
sandbox-workspaceworkspace. The workspace is configured to write runtime logs to logsandbox-workspace-login the Logging service. -
Logging service manages the Data Integration logs in the Log
sandbox-workspace-log. You can view and search the logs using the Logging console or API. -
Service Connector
sandbox-workspace-logs-to-bucketperiodically transfers logs from thesandbox-workspace-loginto the Object Storage bucketsandbox-workspace-logs. -
Object Storage bucket
sandbox-workspace-logscontains the logs as gzipped files in the JSON Lines format, with one log record per line. -
Whenever a new file with logs is created in the bucket
sandbox-workspace-logs, an eventload-data-integration-logs-eventis triggered. The event calls functionpipeline-load-data-integration-logs. -
Function
fn-load-data-integration-logsinvokes Data Integration taskpipeline-load-data-integration-logs, with the name of the new object as parameter. -
Data Integration task
pipeline-load-data-integration-logsloads logs from the new JSON file into the database tableDATA_INTEGRATION_LOGS. -
Table
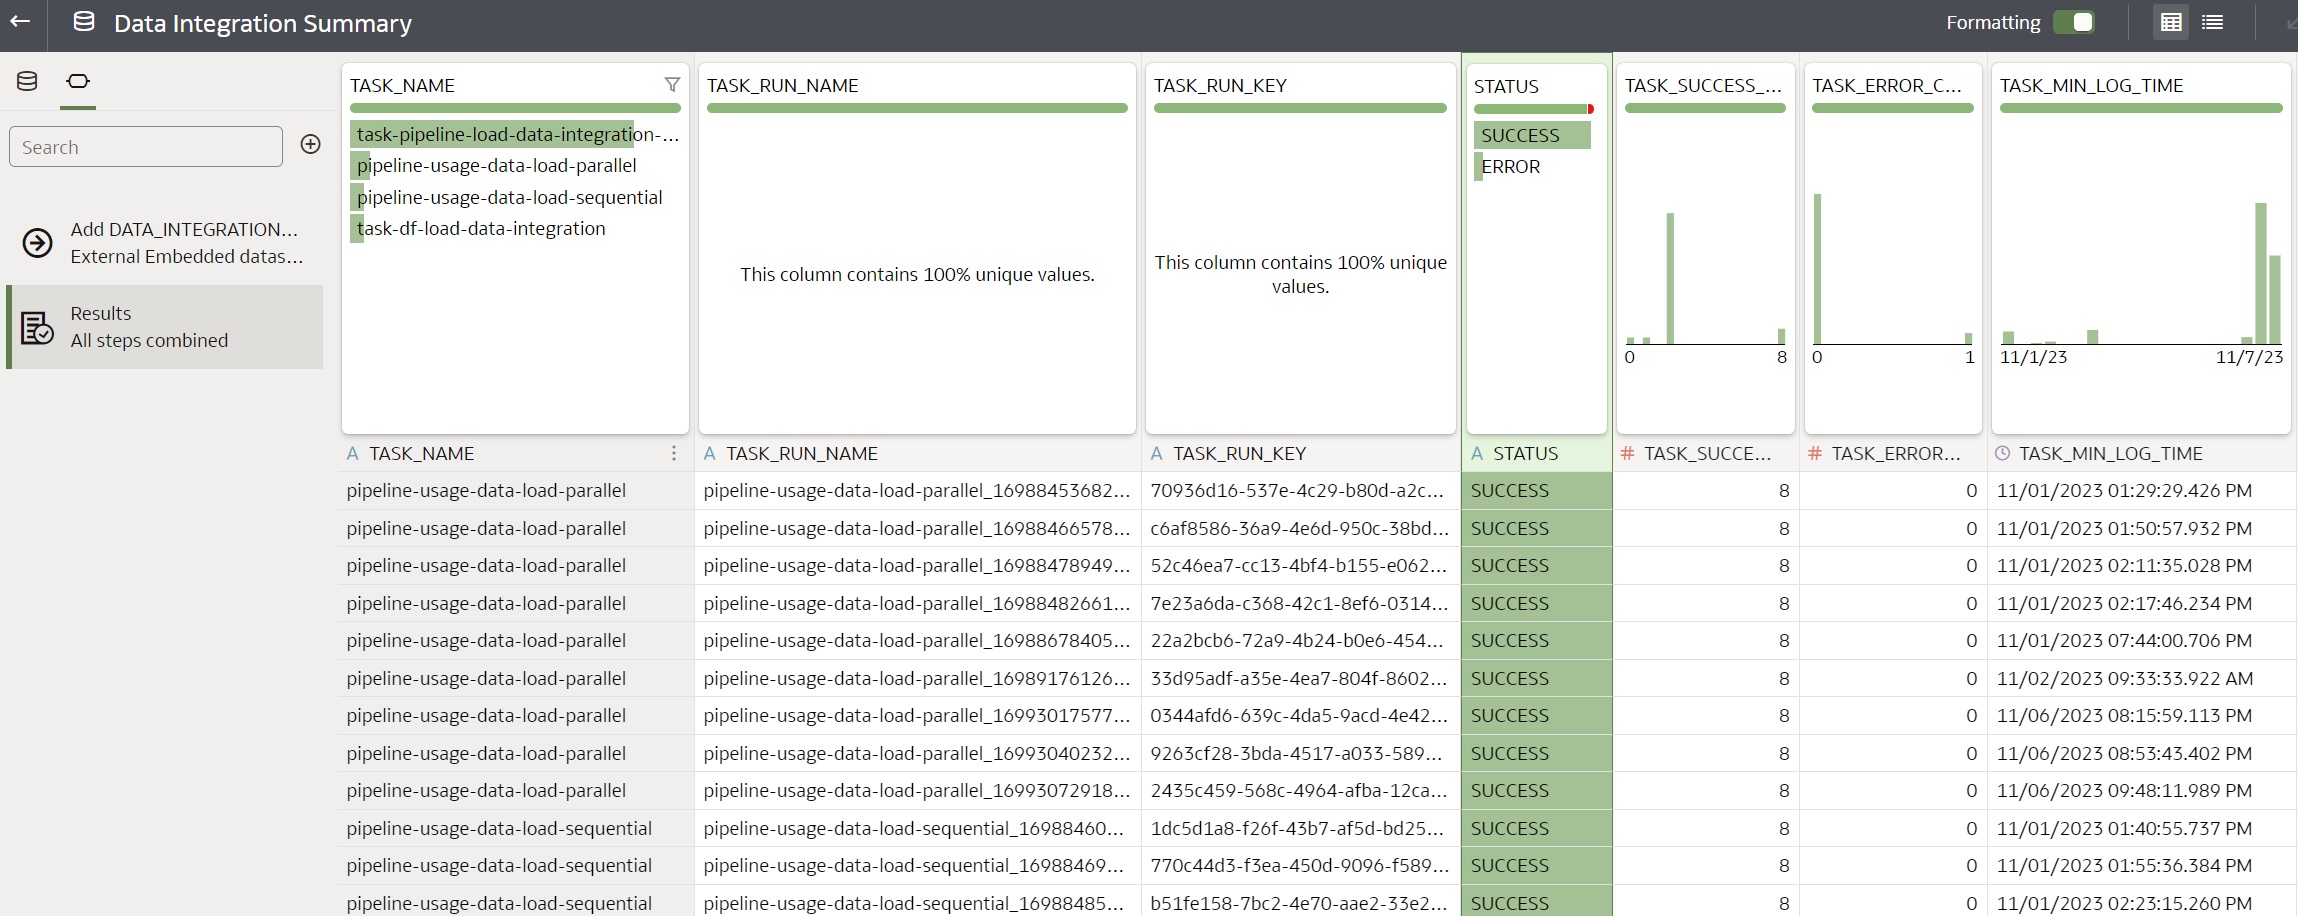
DATA_INTEGRATION_LOGSstores detailed logs. View DATA_INTEGRATION_SUMMARY parses the logs and aggregates them on the level of Data Integration runs. -
Oracle Analytics Cloud workbook
Analyze Data Integration Runsprovides a dashboard for data engineers to analyze Data Integration runtime metadata.
Deployment Cookbook
In this section I describe detailed steps on how to deploy and configure services for the data pipeline.
- A. Enable Data Integration workspace to write logs to Logging service.
- B. Create Service Connector to transfer logs to Object Storage
- C. Develop Data Integration task to load logs to Database
- D. Automate load to database with Events and Functions
- E. Parse, transform, and aggregate logs with Views
- F. Analyze task runs in Oracle Analytics Cloud
For the sake of space I did not include prerequisites, such as provisioning of Autonomous Data Warehouse instance; provisioning of Data Integration workspace, connections, and application; provisioning of Functions application and Registry; and provisioning of Oracle Analytics Cloud instance. I assume the reader is familiar with these services.
A. Enable Data Integration workspace to write logs to Logging service
Configure Policy to Write to Logging
Create policy statement for the Data Integration service to write logs to Logging service.
allow any-user to {dis_workspace_object_create} in compartment sandbox-london where all
{request.service.name = 'dataintegration', request.principal.type = 'service'}
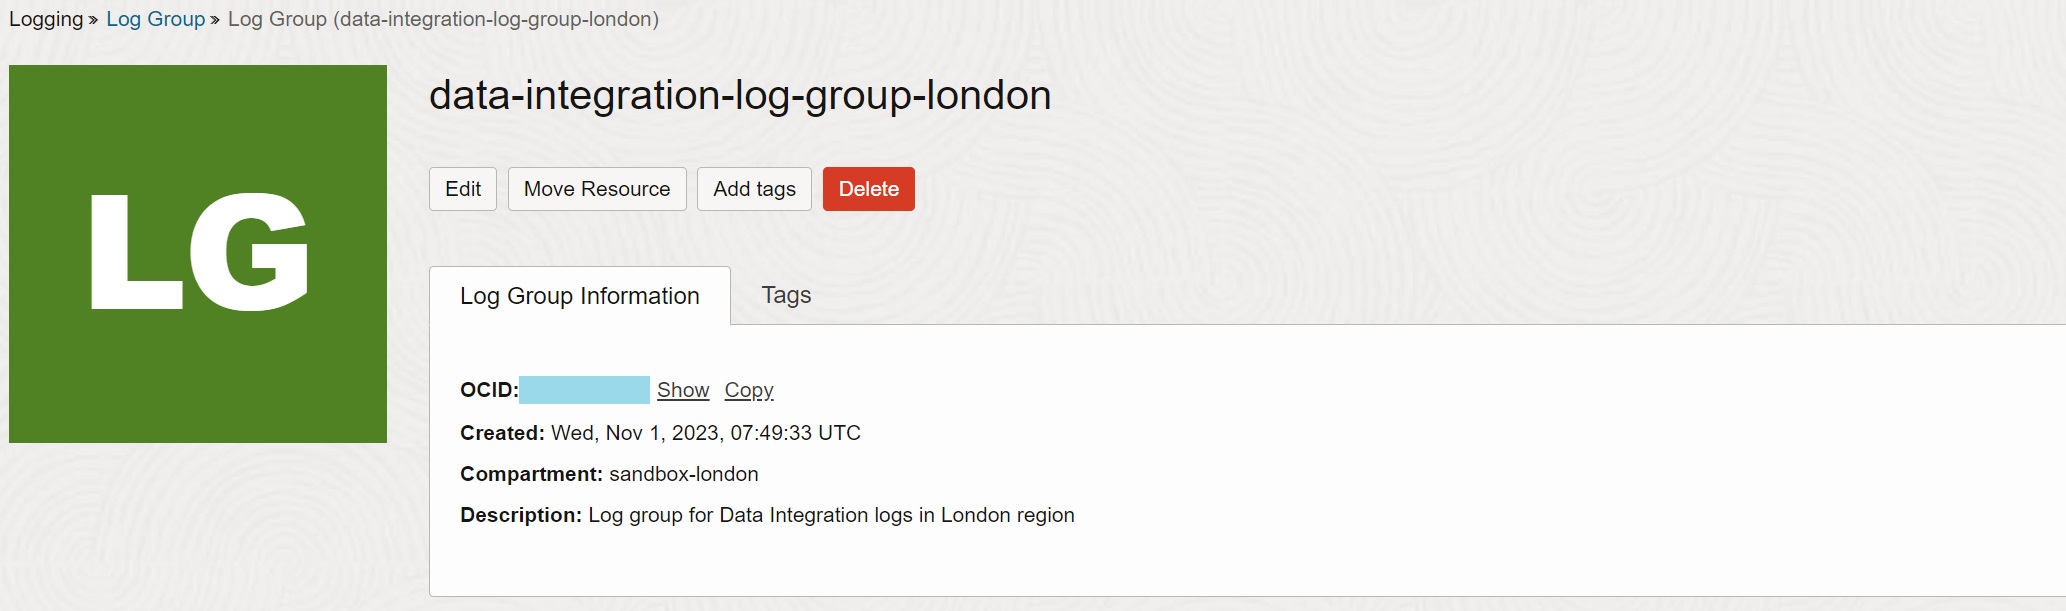
Create Log for Data Integration Workspace
Create Log Group data-integration-log-group-london for all the Data Integration logs.
Enable service Data Integration Service and resource sandbox-workspace (i.e., Data
Integration workspace) to write logs for category DIS Workspace Logs into log
sandbox-workspace-log. Note the default retention period is 30 days.
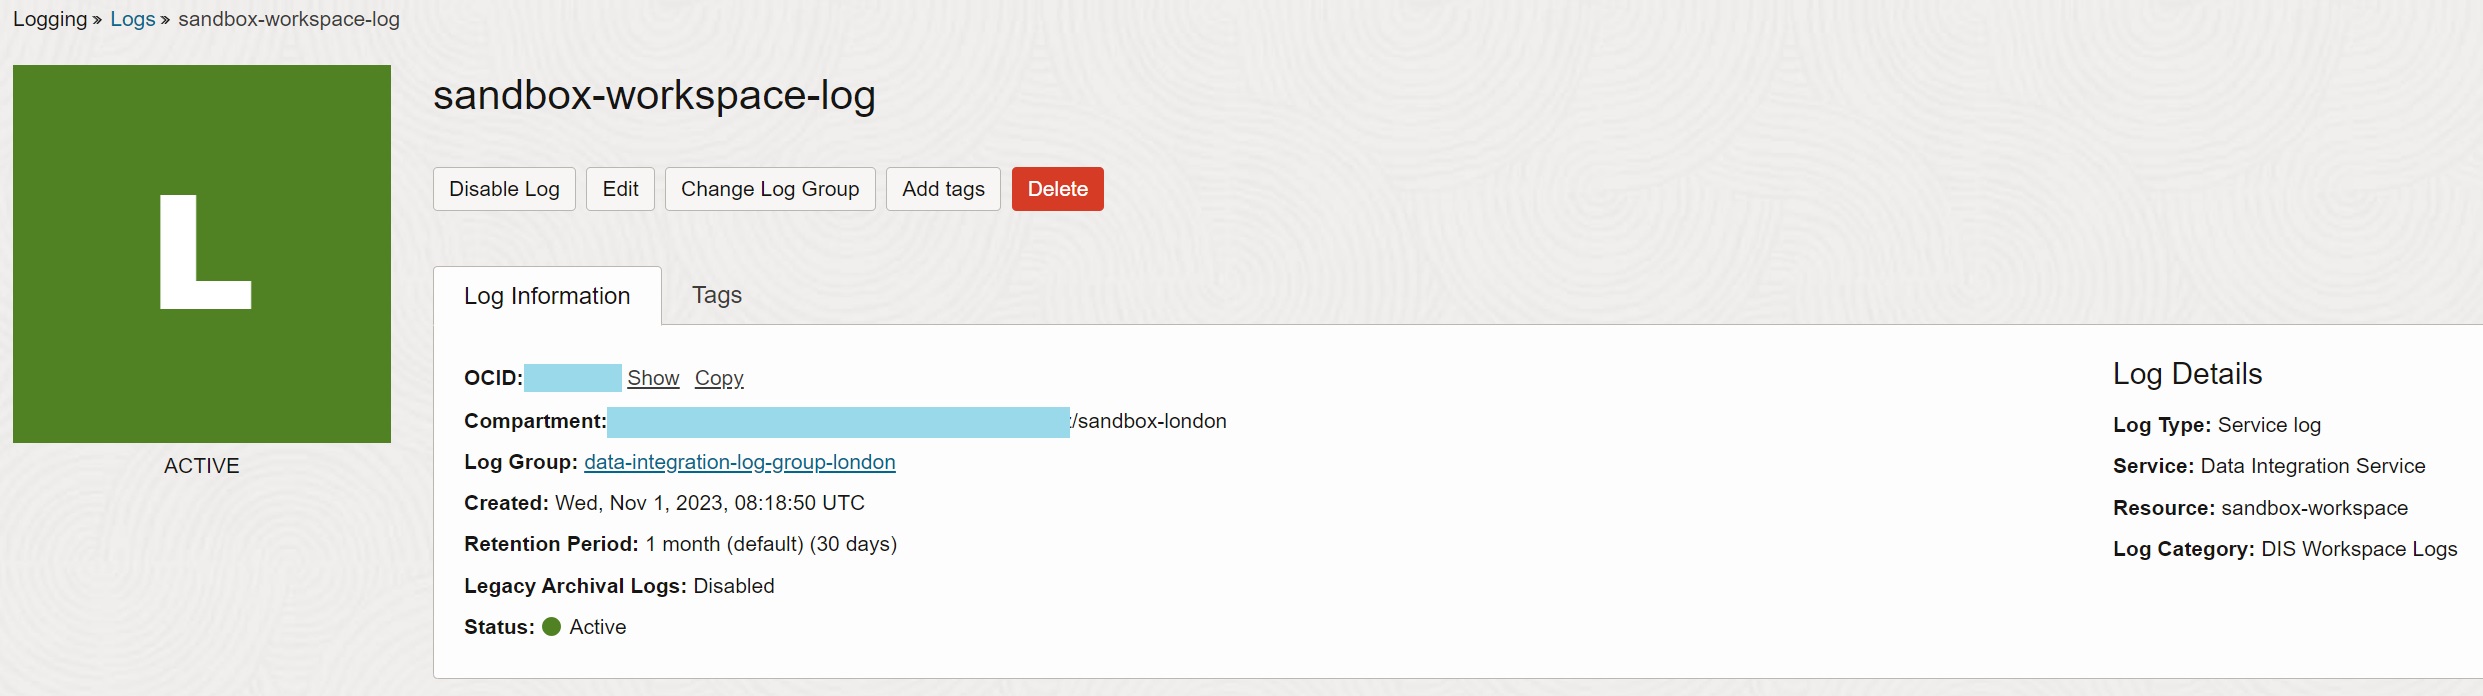
Once this step is finished, any task running in the workspace sandbox-workspace will
generate logs to the Logging service.
B. Create Service Connector to transfer logs to Object Storage
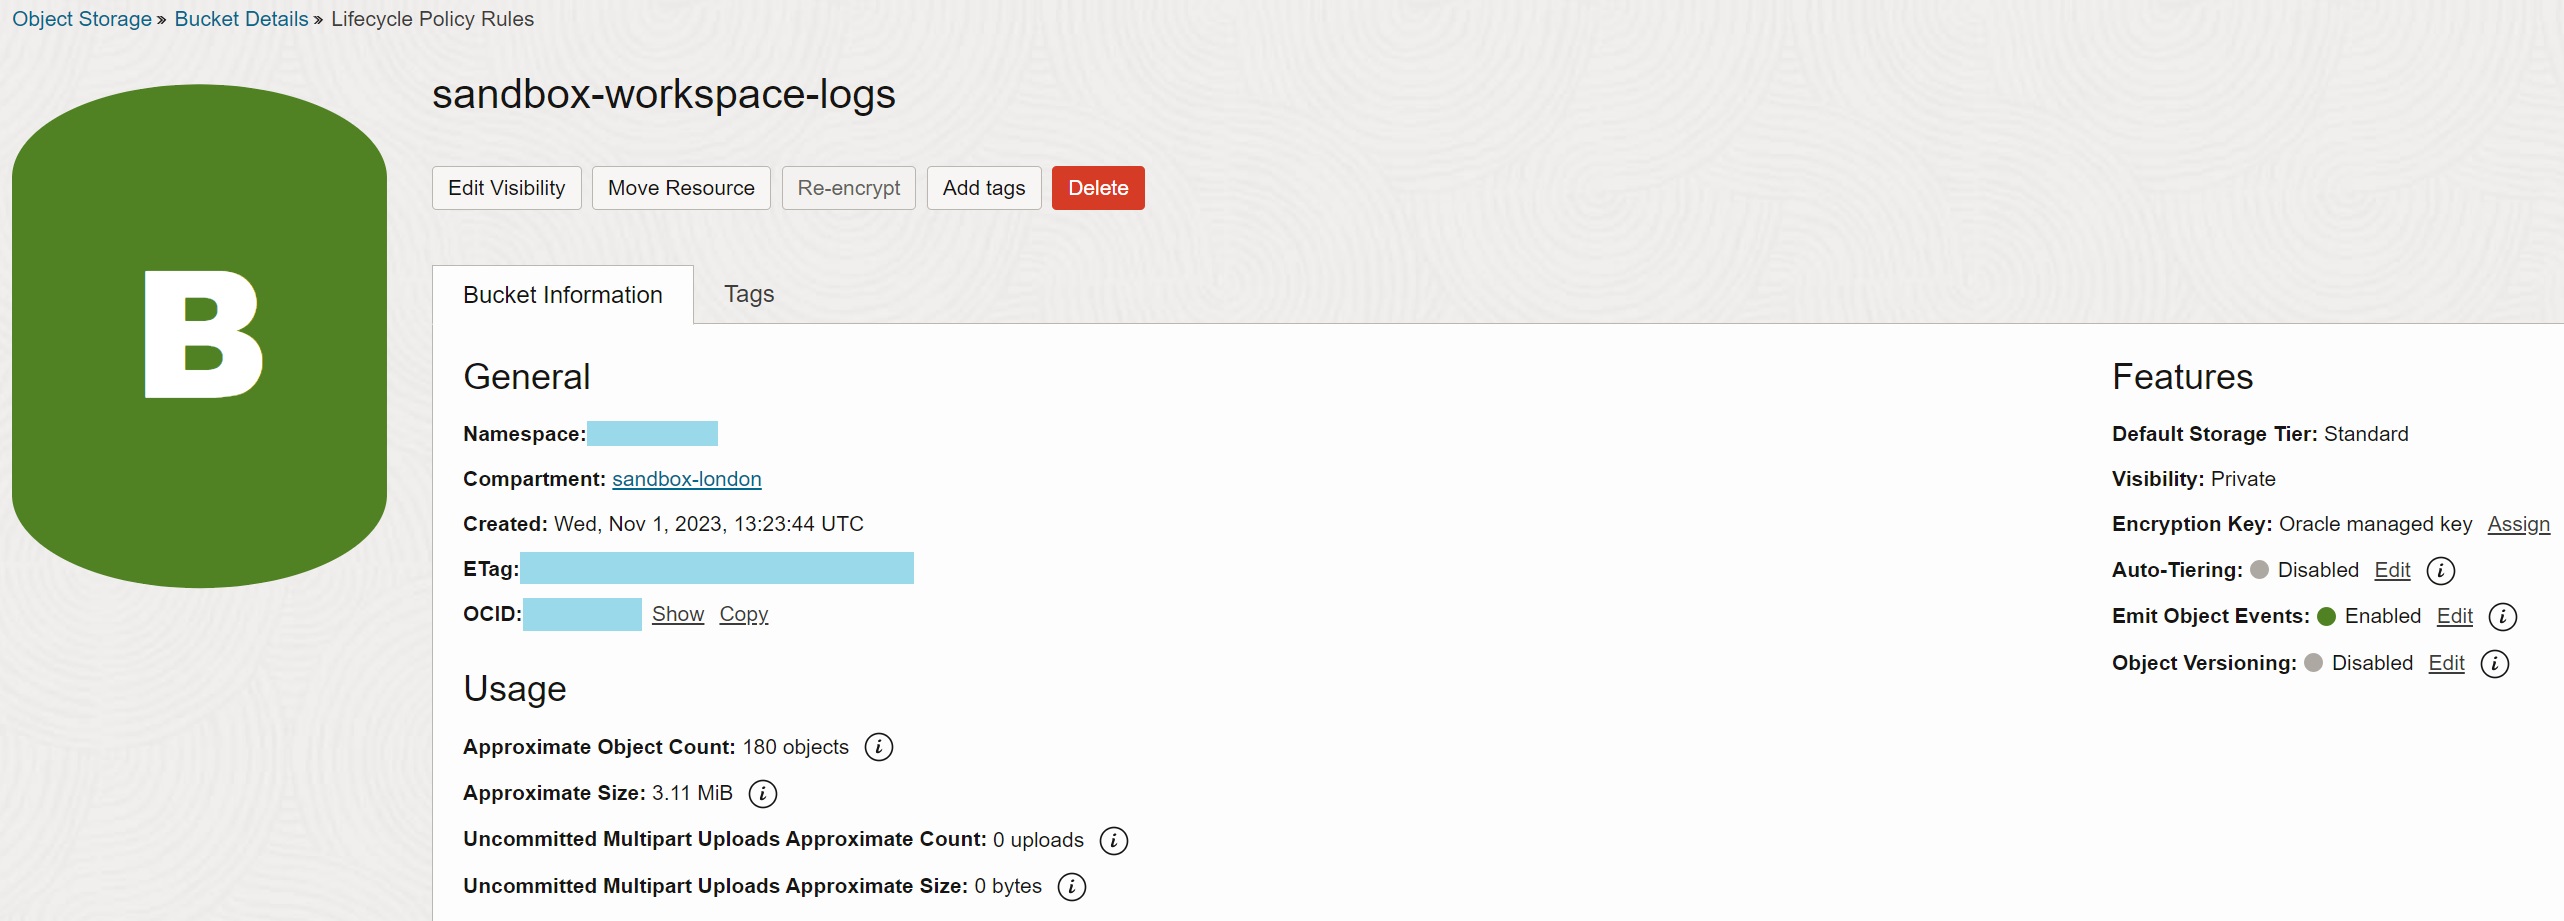
Create Object Storage Bucket
Create Object Storage bucket sandbox-workspace-logs to store the logs. Enable Emit
Object Events for the bucket. Consider also creating lifecycle rule to delete objects
after some time, as the bucket is used for staging, not as the permanent storage.
Configure Policy for Service Connector
Create policy statement for the Connector Hub service to write objects into Object Storage bucket.
allow any-user to manage objects in compartment id <Compartment OCID> where all
{request.principal.type='serviceconnector', target.bucket.name='sandbox-workspace-logs',
request.principal.compartment.id='<Compartment OCID>'}
Create Service Connector
As the last step, create Service Connector sandbox-workspace-logs-to-bucket to move
logs from the log sandbox-workspace-log to the bucket sandbox-workspace-logs. Note you
can specify how frequently are the logs written to the bucket - when the batch time or the
batch size is reached.
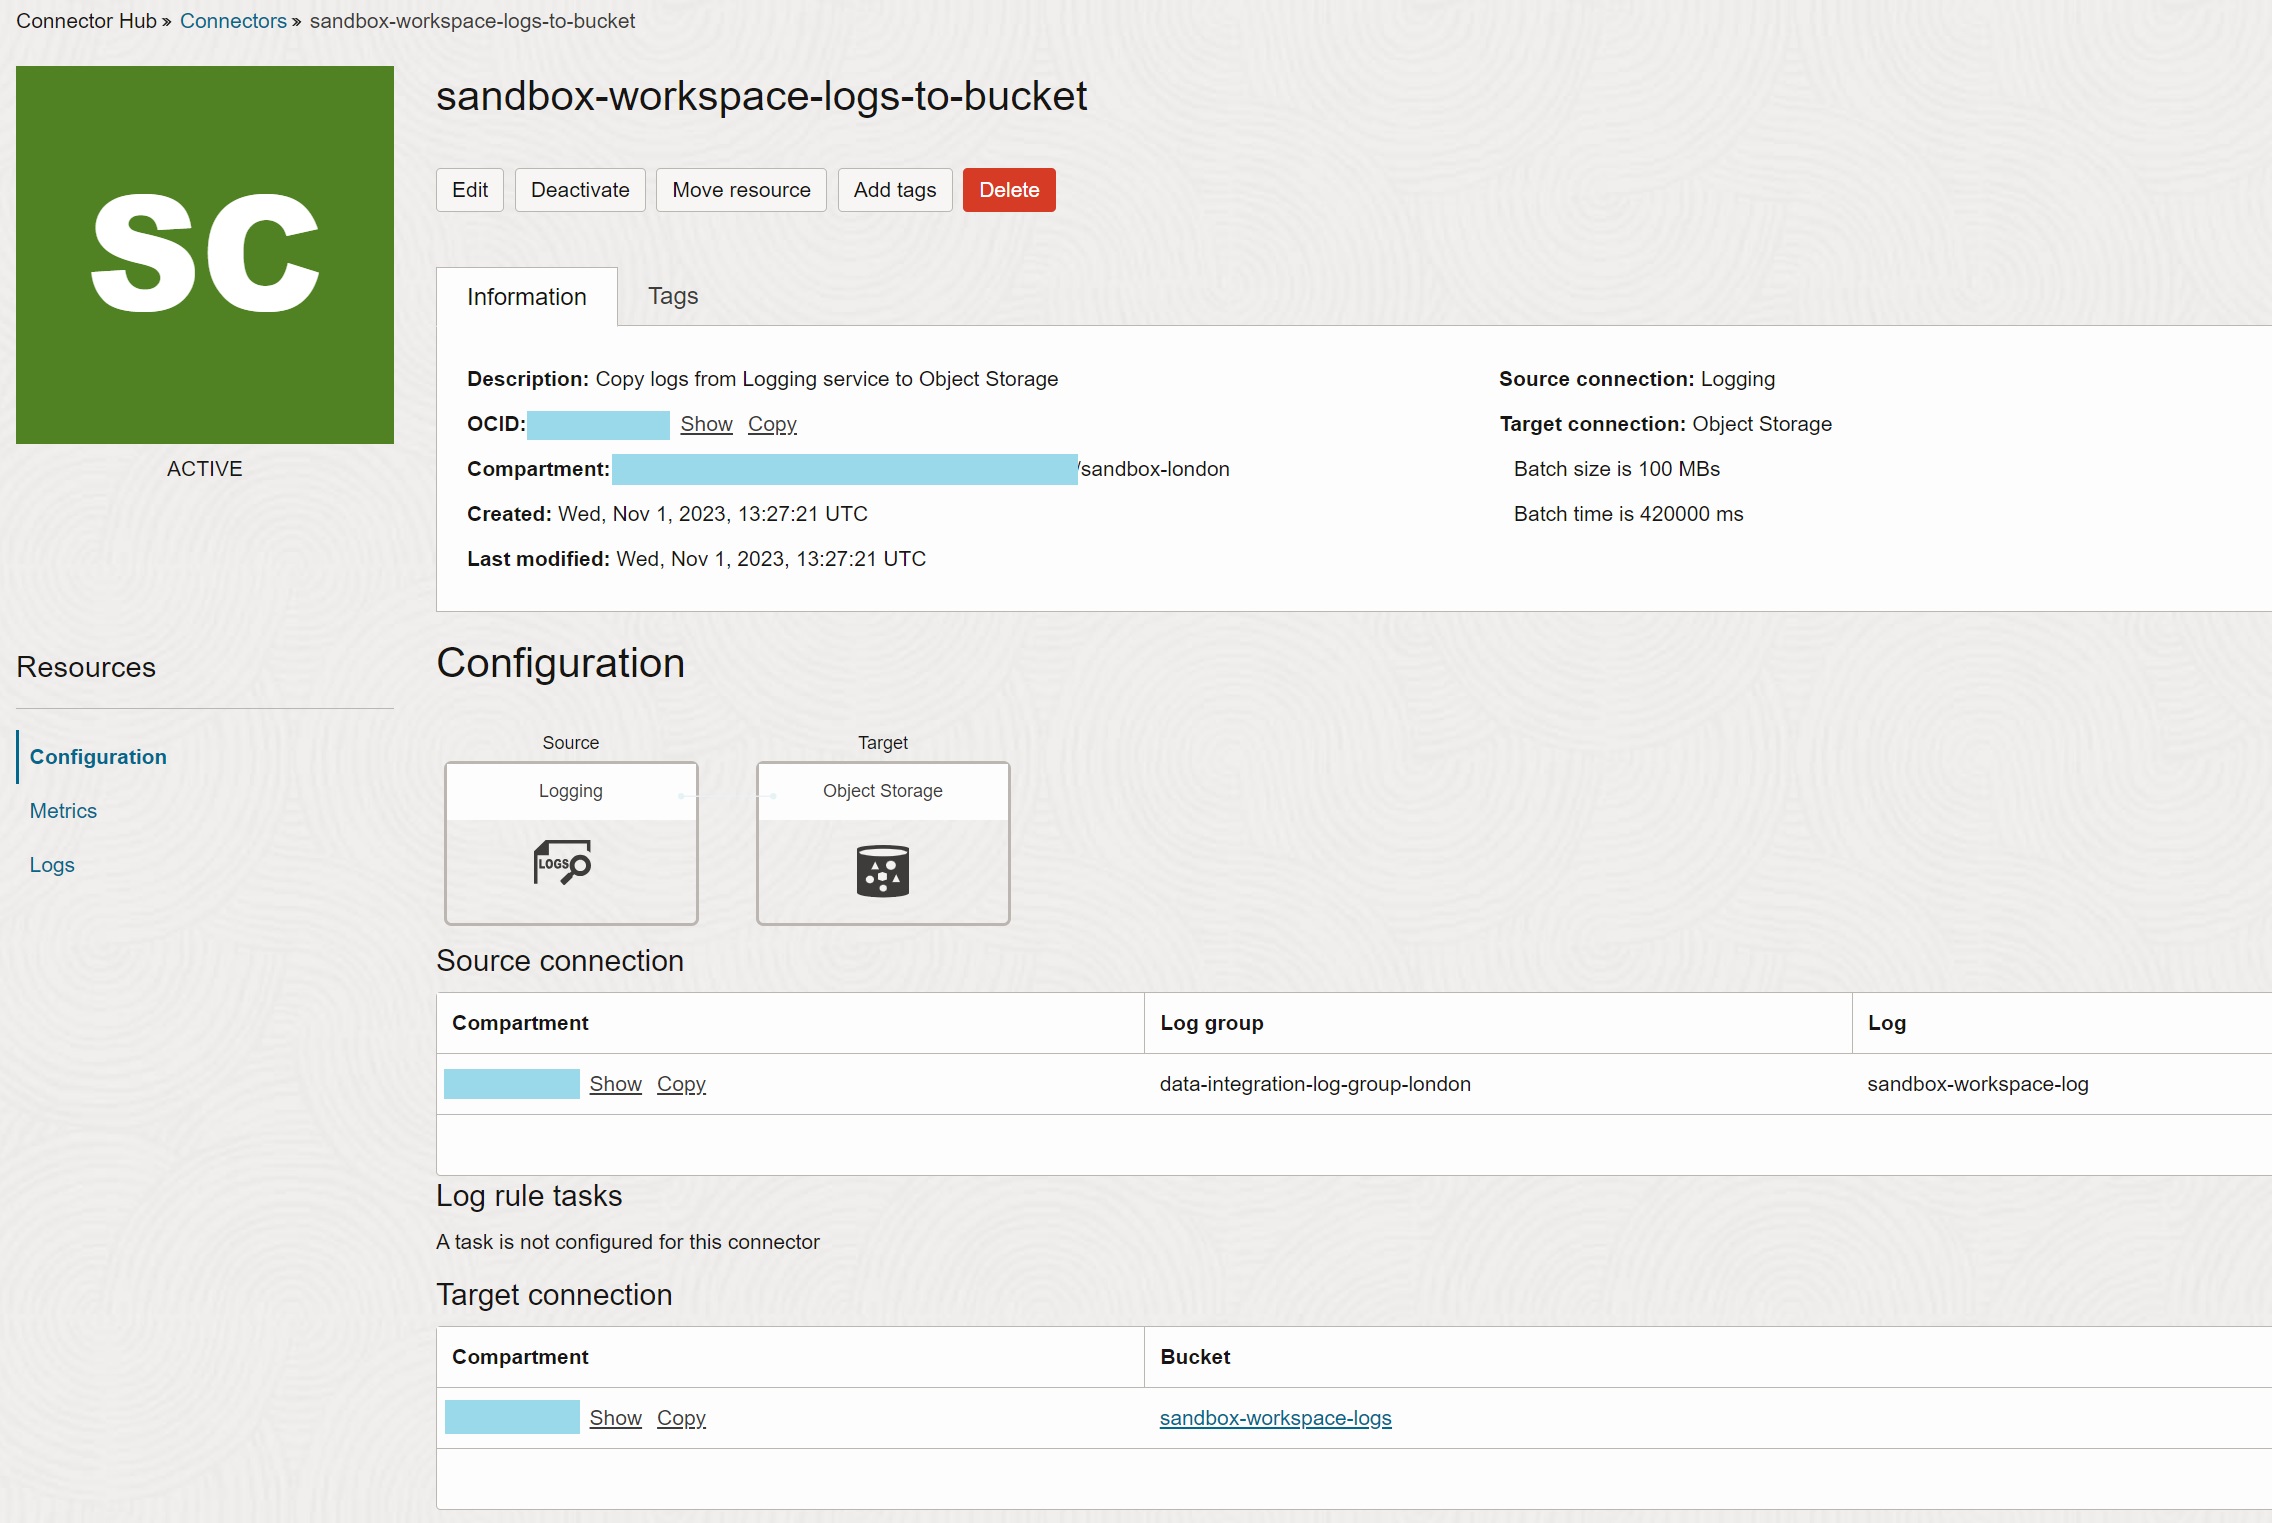
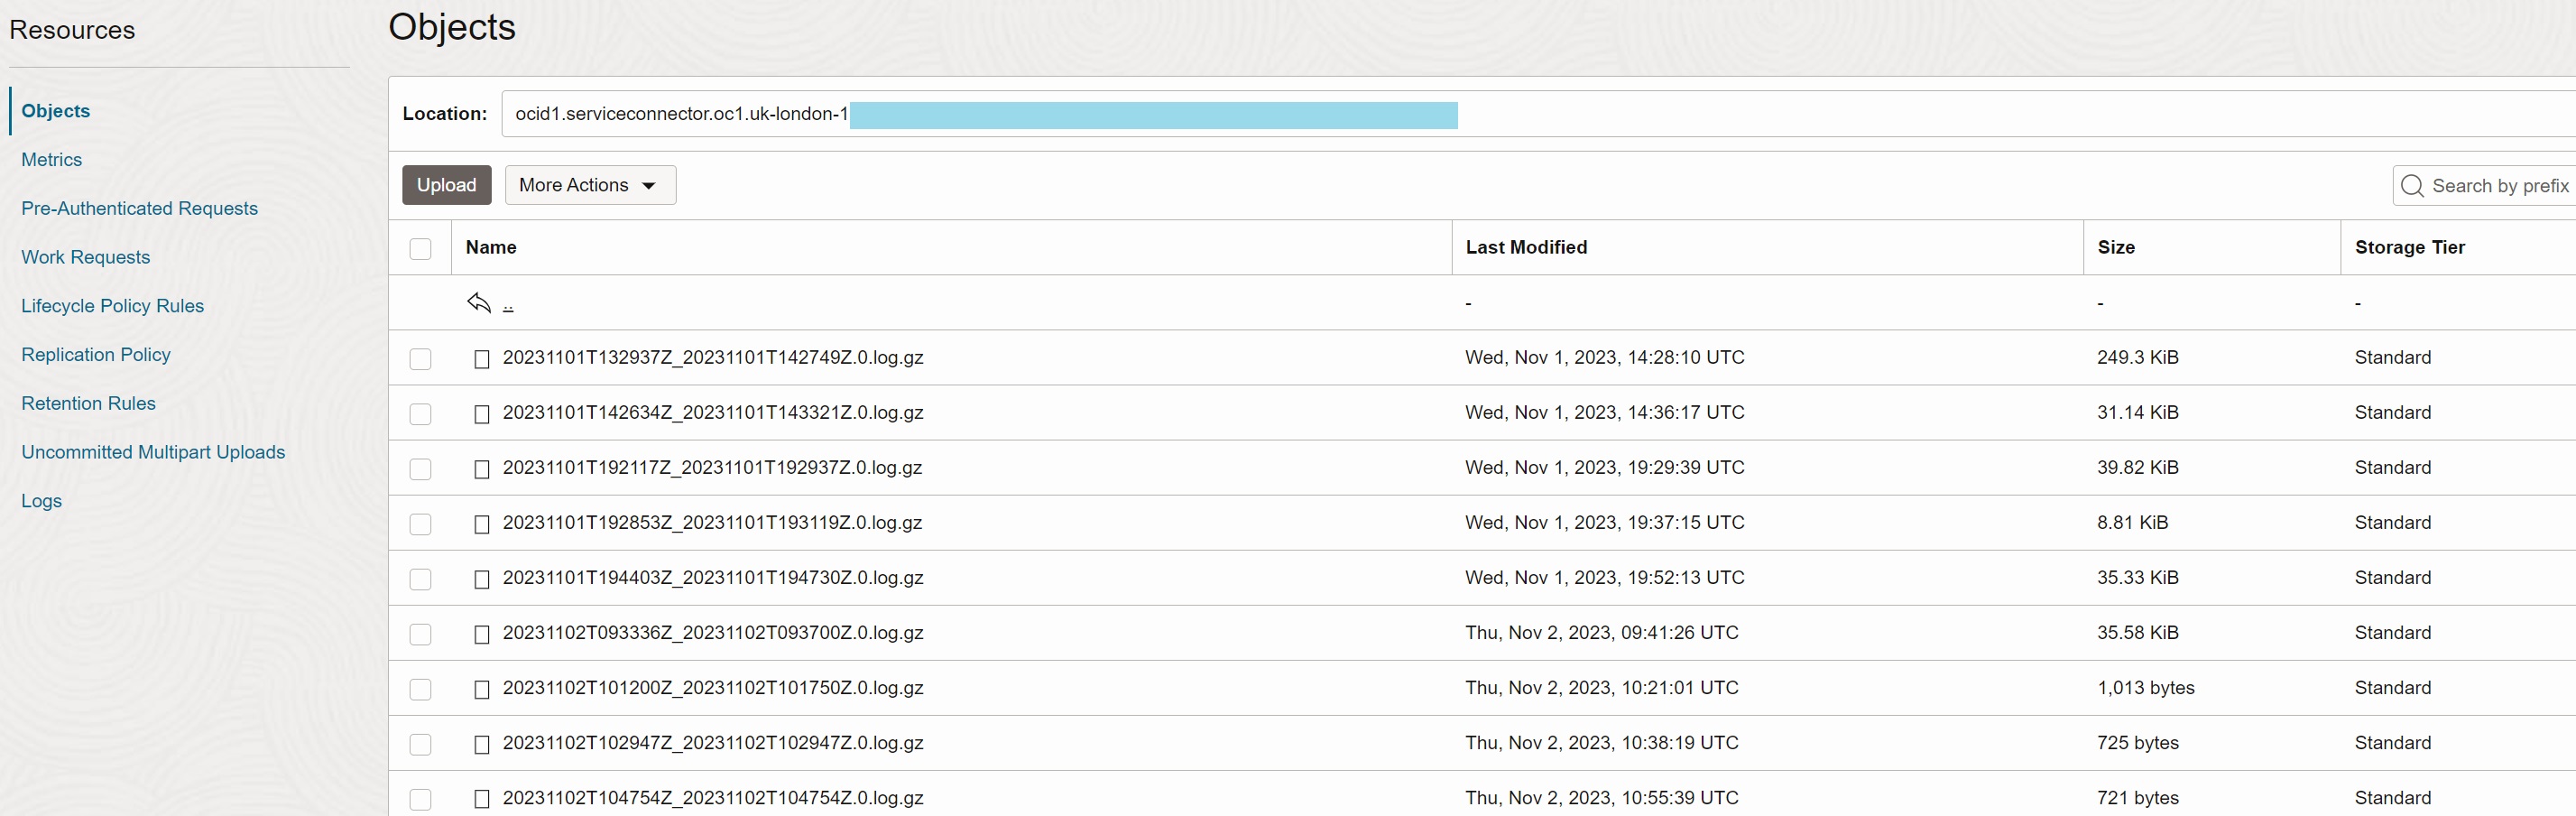
Once this step is finished, logs from the running tasks in the workspace are periodically transferred into the gzipped files in the Object Storage bucket. Note the object names use OCID of the service connector as the prefix.
C. Develop Data Integration task to load logs to Database
Create Database Table
Create database table DATA_INTEGRATION_LOGS in Autonomous Data Warehouse instance to
store detailed logs in the flattened structure.
You can see that for every field in the source JSON document, there is a
corresponding column in the table. Also, the table is extended by OBJECT% columns with
the information about file names and paths from which the records were loaded.
create table data_integration_logs (
  log_id                      varchar2(200) not null,
  log_time                    timestamp not null,
  log_type                    varchar2(200) not null,
  log_source                  varchar2(1000),
  log_specversion             varchar2(200),
  log_data_log_level          varchar2(100),
  log_data_message            varchar2(32767),
  log_data_object_id          varchar2(1000),
  log_data_opc_request_id     varchar2(1000),
  log_data_workspace_id       varchar2(1000),
  log_oracle_compartment_id   varchar2(1000),
  log_oracle_ingested_time    timestamp,
  log_oracle_log_group_id     varchar2(1000),
  log_oracle_log_id           varchar2(1000),
  log_oracle_tenant_id        varchar2(1000),
  object_file_name            varchar2(1000),
  object_path                 varchar2(1000),
  object_last_modified        timestamp,
  object_version_id           varchar2(100)
);
Configure Resource Principal and Policy for Workspace
Include the workspace sandbox-workspace into the dynamic group platform-agents-dg
to allow resource principal authentication.
all{resource.type = 'disworkspace', resource.compartment.id = '<Compartment OCID>'}
Create policy statement for dynamic group platform-agents-dg, that will allow the
resources in the group to access the Object Storage buckets and objects. Database access
is authenticated and authorized by the username and password, entered when creating a
database connection.
allow dynamic-group platform-agents-dg to read object-family in compartment sandbox-london
Create Data Flow Task
Create data flow task df-load-data-integration-logs in Data Integration to load file
from the bucket sandbox-workspace-logs to the table DATA_INTEGRATION_LOGS. The name of
the file to be loaded is parameterized, via the parameter P_OBJECT_NAME.
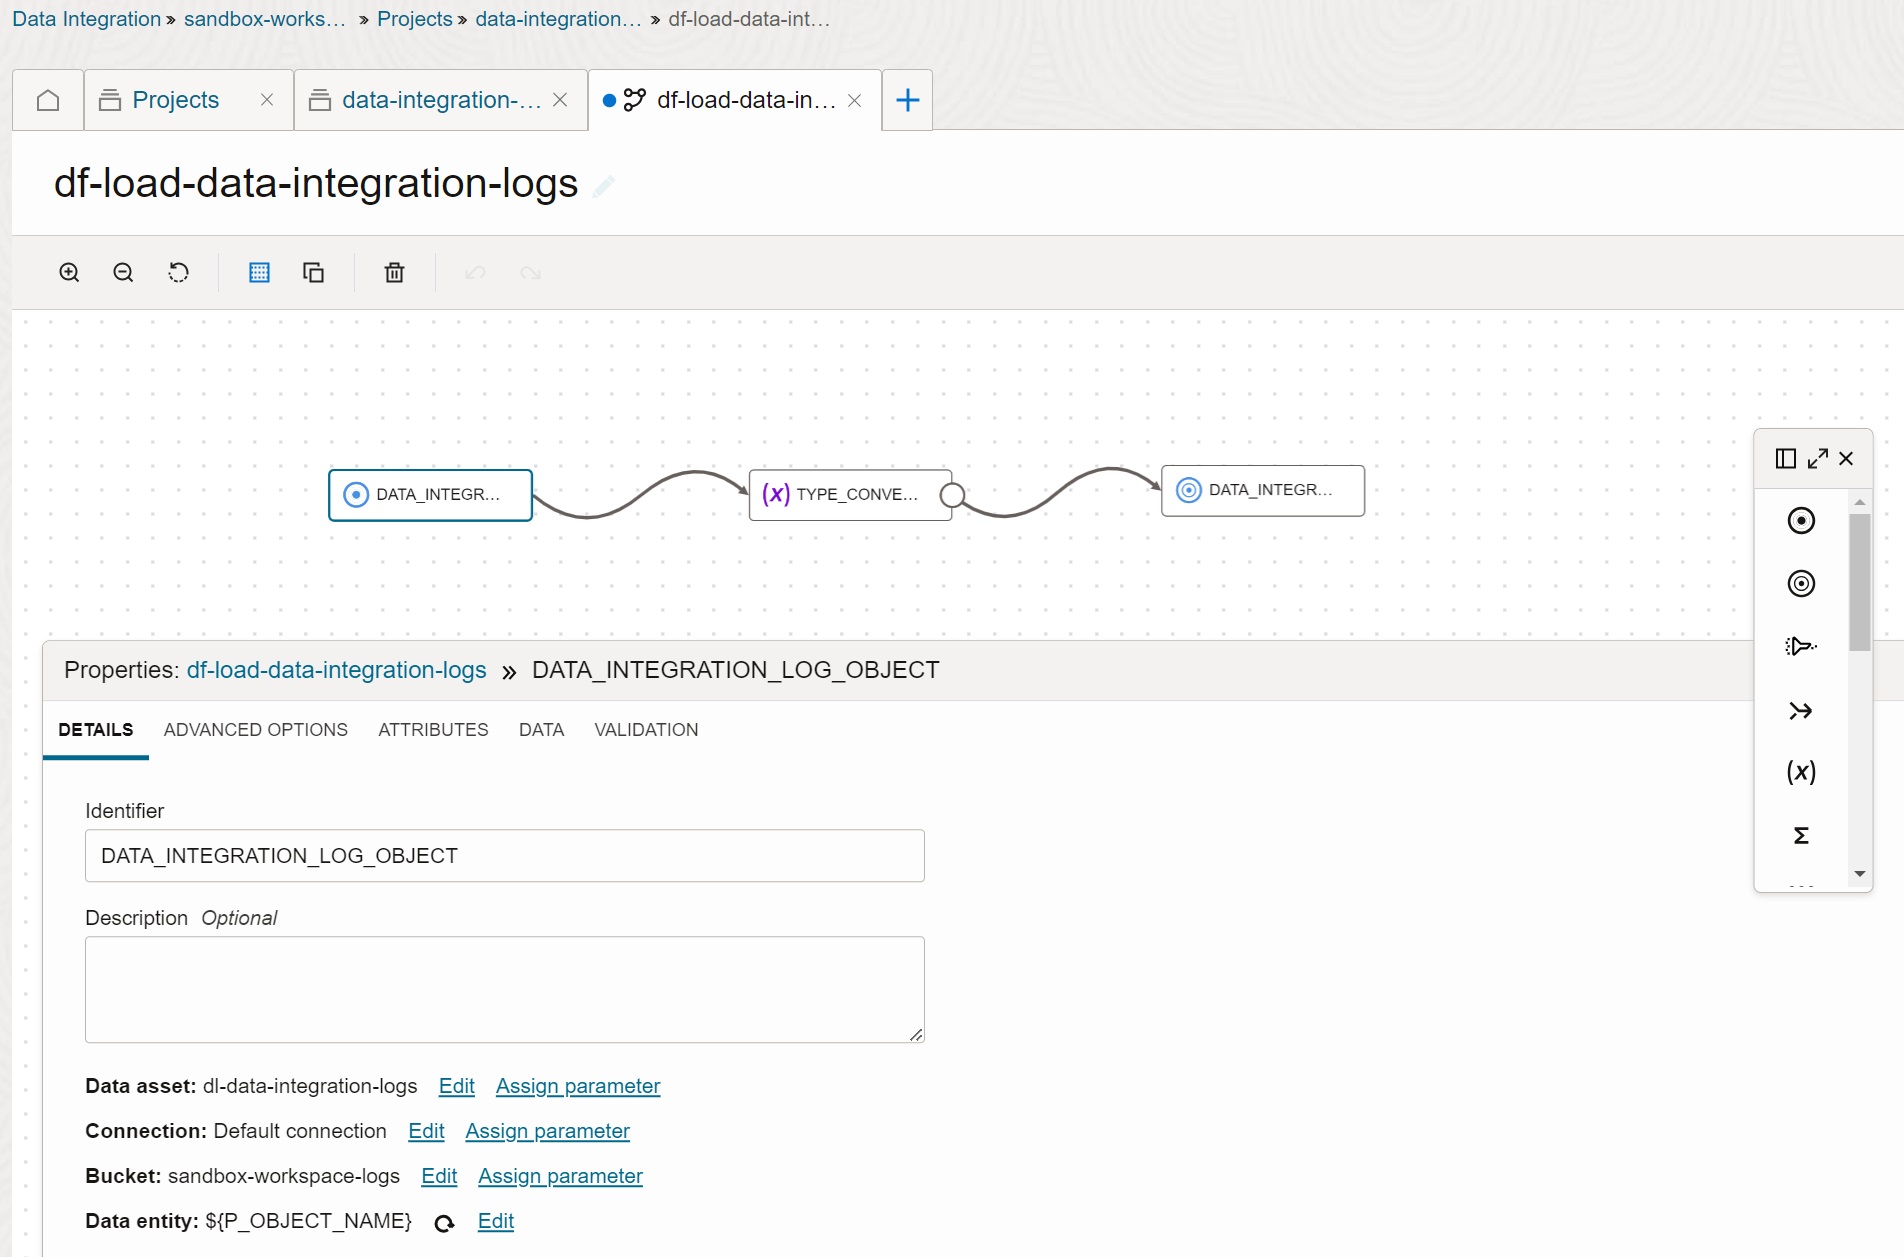
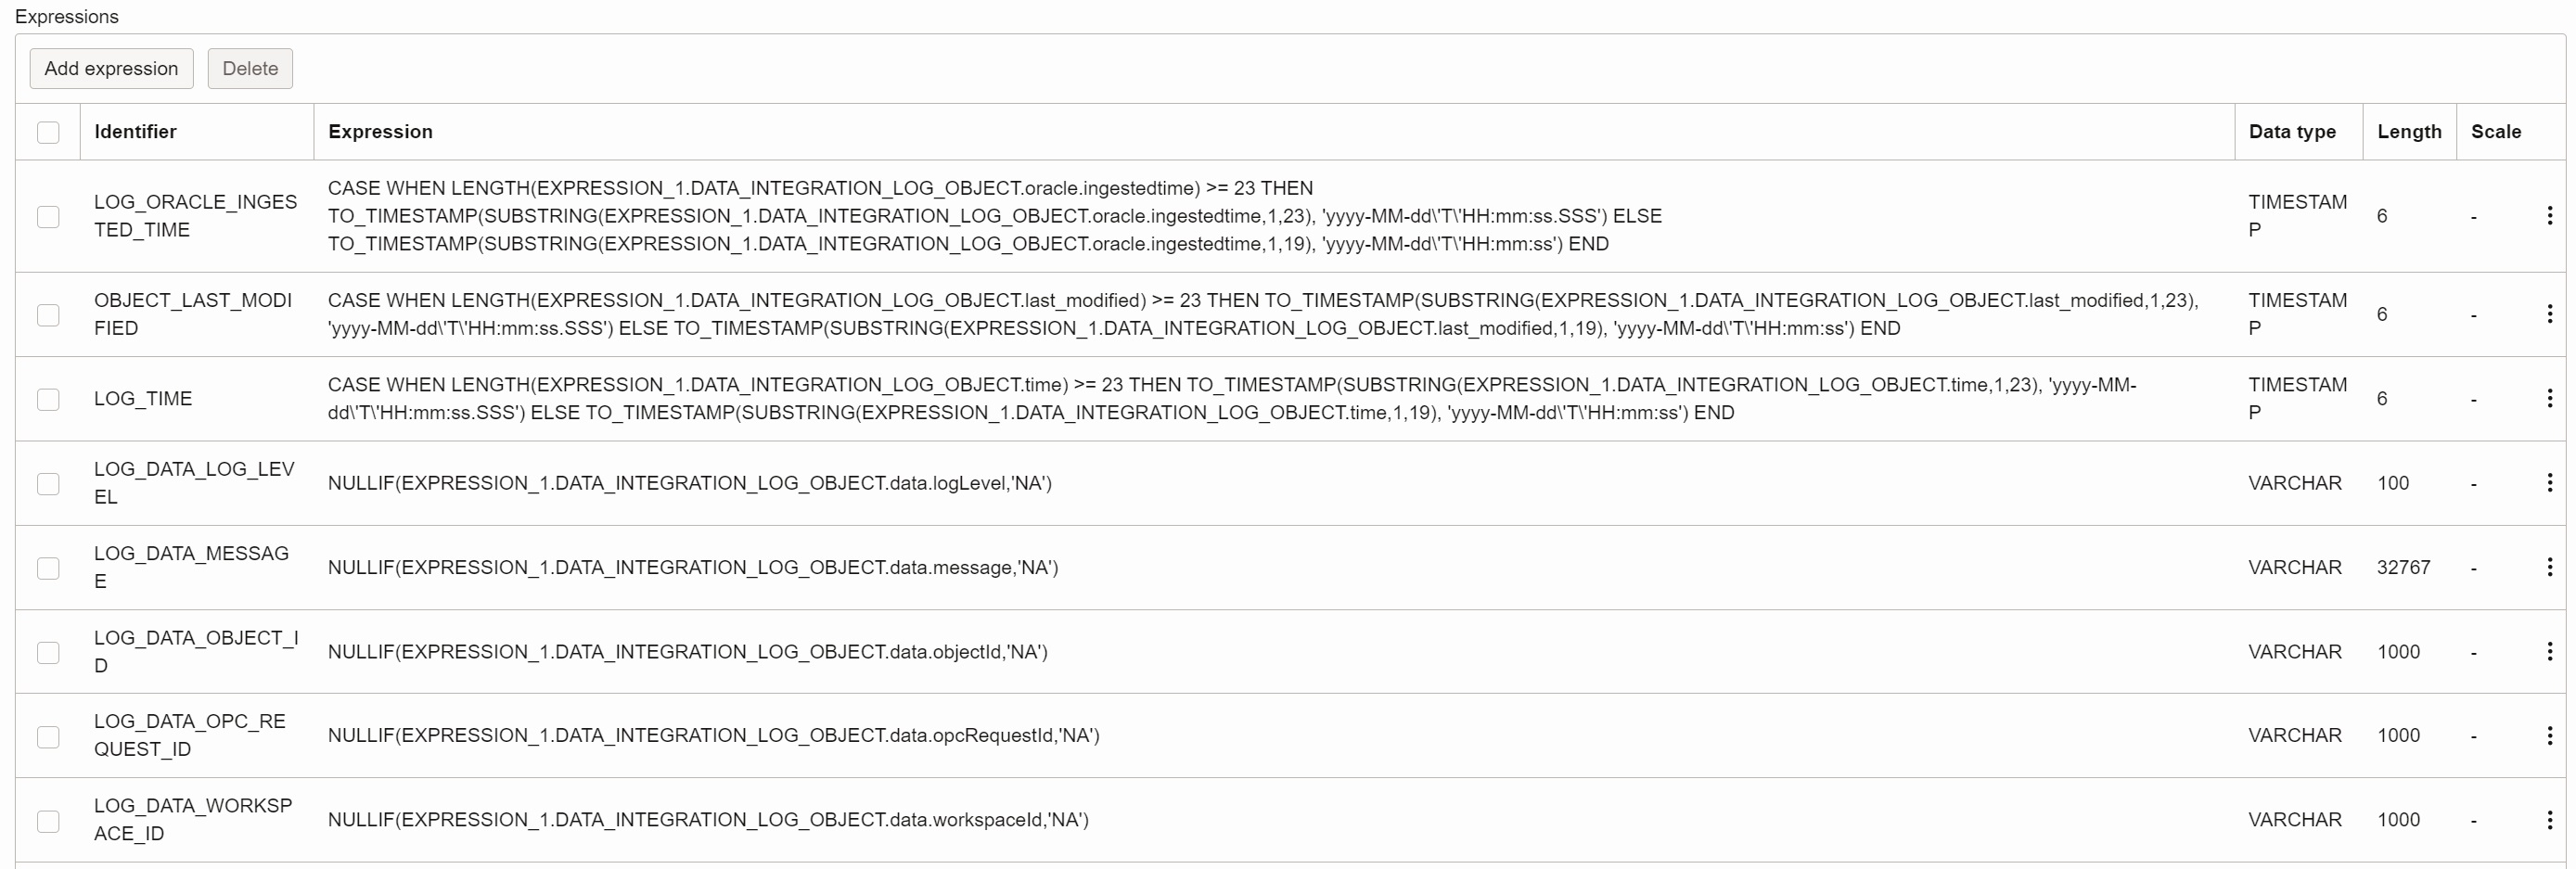
The mapping in the data flow task is straightforward - it maps every scalar field in the
log JSON structure to the database column. Fields with value NA are nullified. Timestamp
fields are converted to the TIMESTAMP data type. Note that some timestamp values in the
log have fractional seconds while the others do not have them.
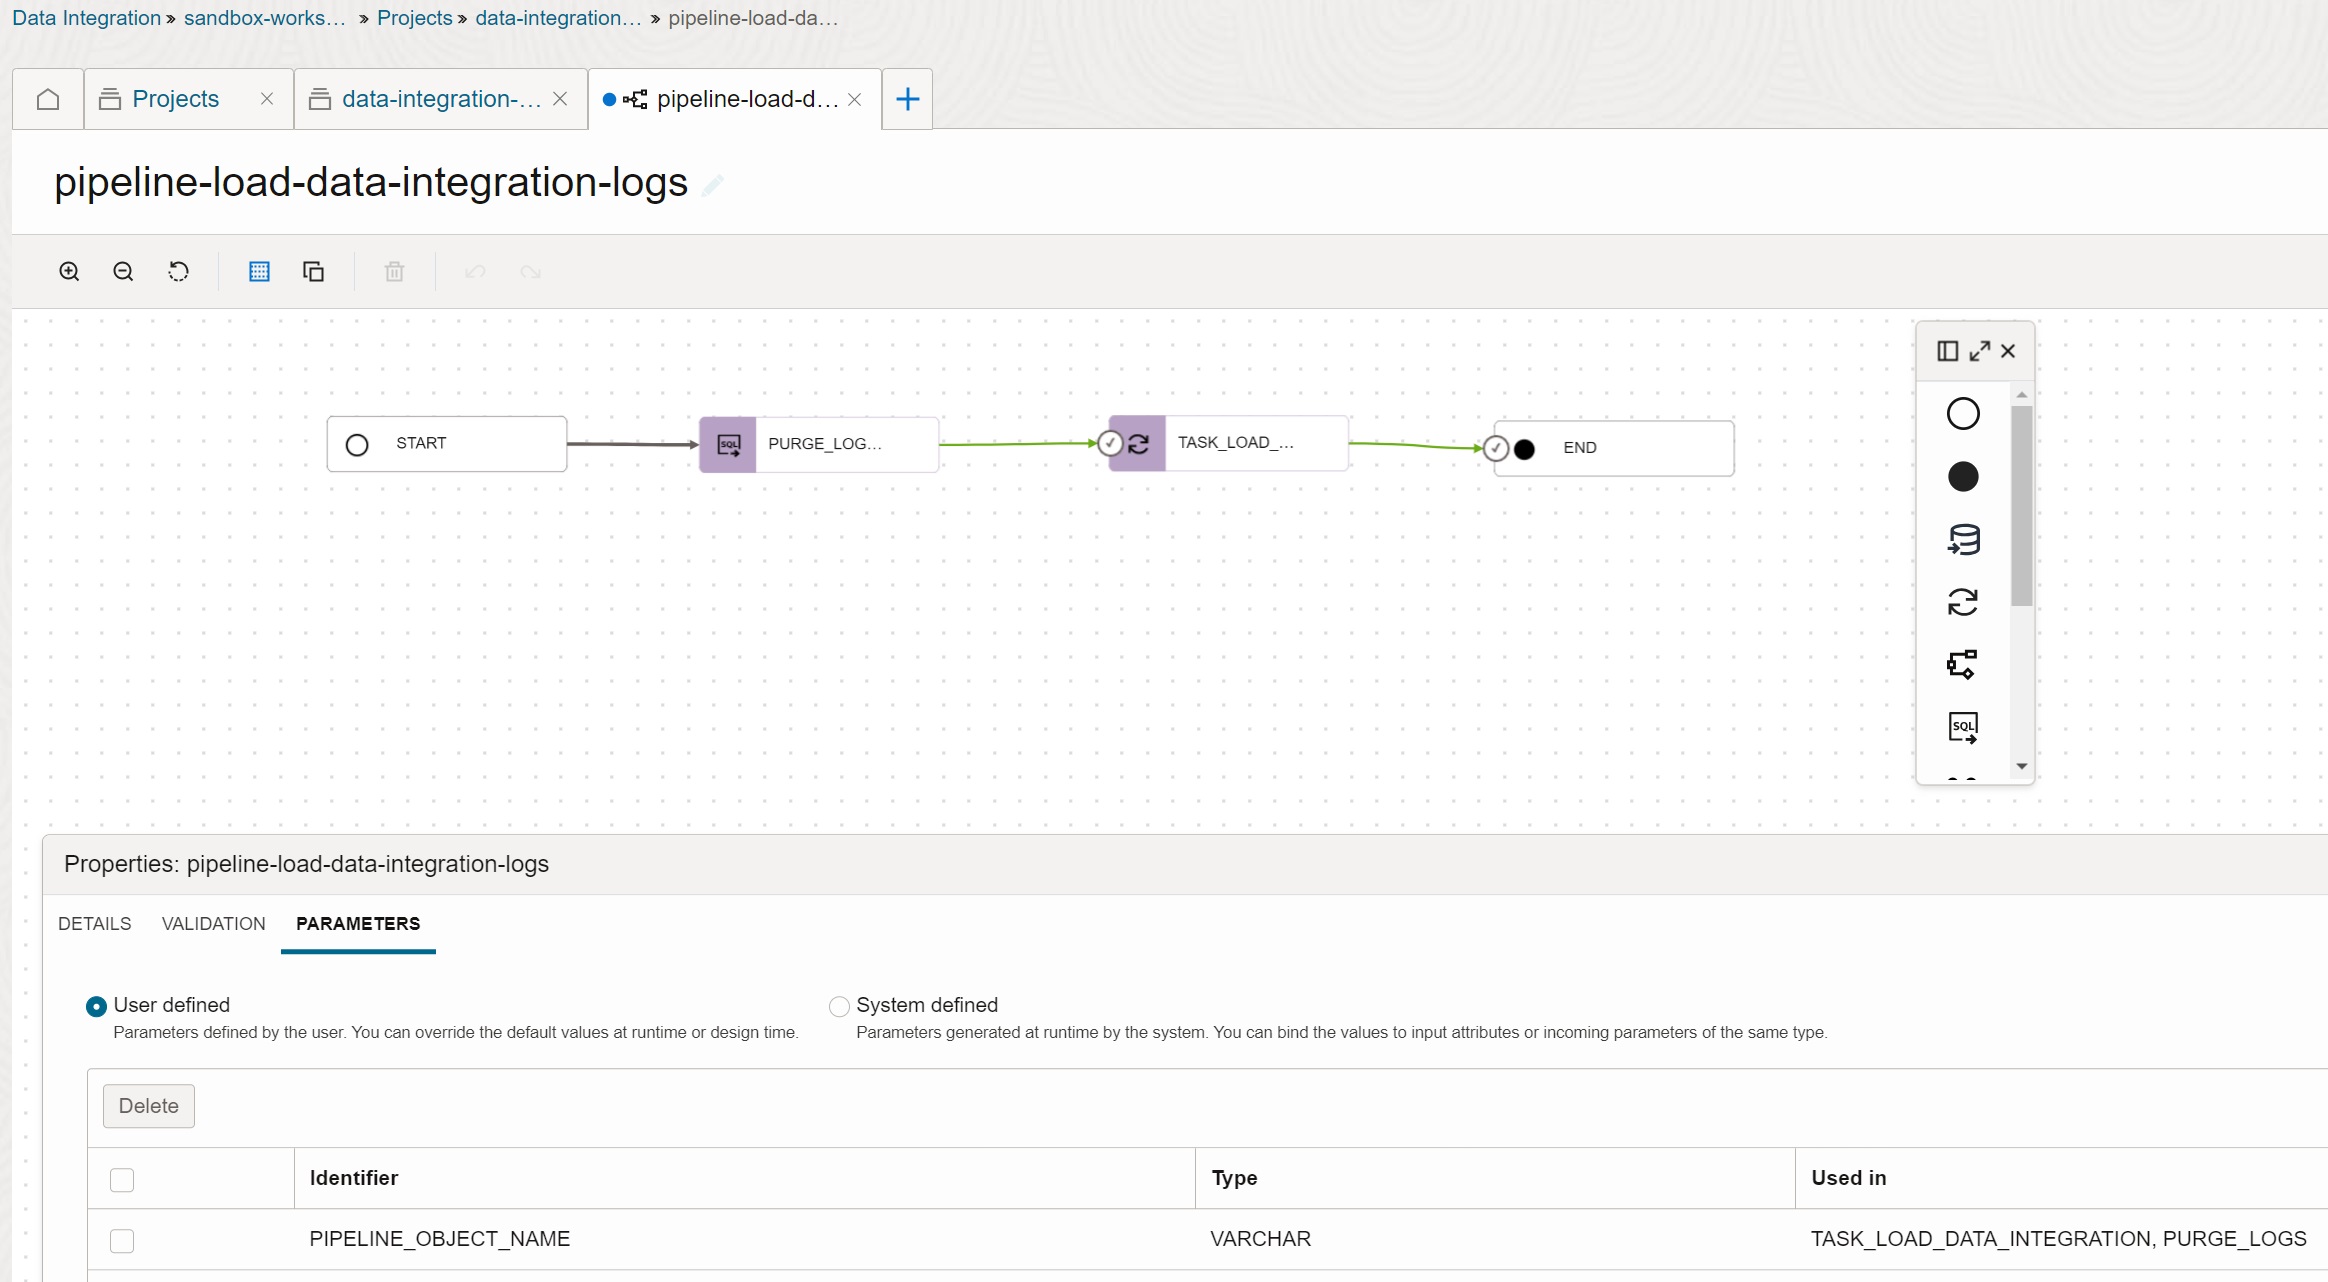
Create Pipeline Task
Create pipeline task pipeline-load-data-integration-logs. This pipeline task calls SQL
task task-sql-purge-data-integration-logs to purge logs (in case the input file is
loaded repeatedly), and then it calls data flow task df-load-data-integration-logs to
load logs. All tasks are parameterized by the parameter P_OBJECT_NAME.
D. Automate load to database with Events and Functions
Create and Deploy Function
Create Python function fn-load-data-integration-logs to invoke the Data Integration
task pipeline-load-data-integration-logs. Please refer to the post
Event Driven Automation of OCI Data Integration Tasks
for walkthrough of the function.
import io
import json
import datetime
import logging

from fdk import response
import oci

def handler (ctx, data: io.BytesIO=None):

    # Get configuration parameters
    configuration = ctx.Config()
    v_workspace_id = configuration['workspace_id']
    v_application_key = configuration['application_key']
    v_aggregator_key = configuration['aggregator_key']
    v_connection_key = configuration['connection_key']
    logging.info('configuration: workspace_id={}, application_key={}, aggregator_key={}, connection_key={}'.format(v_workspace_id, v_application_key, v_aggregator_key, v_connection_key))


    # Get event parameters
    input_params = json.loads(data.getvalue())
    v_event_type = input_params["eventType"]
    v_compartment_name = input_params["data"]["compartmentName"]
    v_namespace_name = input_params["data"]["additionalDetails"]["namespace"]
    v_source_bucket_name =  input_params["data"]["additionalDetails"]["bucketName"]
    v_source_object_name = input_params["data"]["resourceName"]
    v_source_object_id = input_params["data"]["resourceId"]
    logging.info('payload: event_type={}, source_bucket_name={}, source_object_name={}'.format(v_event_type, v_source_bucket_name, v_source_object_name))


    # Get OCI DI client using resource principal
    v_oci_signer = oci.auth.signers.get_resource_principals_signer()
    v_oci_di_client = oci.data_integration.DataIntegrationClient(config={}, signer=v_oci_signer)

    # Define parameters to run OCI DI task
    v_registry_metadata = oci.data_integration.models.RegistryMetadata(aggregator_key=v_aggregator_key)

    v_config_provider = oci.data_integration.models.CreateConfigProvider(
        bindings= {
            'PIPELINE_OBJECT_NAME' : oci.data_integration.models.ParameterValue(simple_value=v_source_object_name),
        }
    )

    v_task_details = oci.data_integration.models.CreateTaskRunDetails(
        registry_metadata=v_registry_metadata,
        config_provider=v_config_provider
    )

    # Invoke OCI DI task
    v_response = v_oci_di_client.create_task_run(
        workspace_id=v_workspace_id,
        application_key=v_application_key,
        create_task_run_details=v_task_details
    )

    # Return result
    logging.info('result: request_status={}, task_run_name={}, task_run_status={}, opc_request_id={}'.format(v_response.status, v_response.data.name, v_response.data.status, v_response.data.opc_request_id))
    return response.Response( ctx, response_data = json.dumps({'message' : 'OCI DI task submitted for execution'}), headers = {"Content-Type": "application/json"} )
After the function fn-load-data-integration-logs is created, configure the required
parameters.
fn config function sandbox-london-fnapp fn-load-data-integration-logs workspace_id    '<Workspace OCID>'
fn config function sandbox-london-fnapp fn-load-data-integration-logs application_key '<Application Key>'
fn config function sandbox-london-fnapp fn-load-data-integration-logs aggregator_key  '<Pipeline Task Key>'
fn config function sandbox-london-fnapp fn-load-data-integration-logs connection_key  '<Connection Key>'
Configure Resource Principal and Policy for Function
Include the function fn-load-data-integration-logs into dynamic group platform-agents-dg
to allow resource principal authentication.
all {resource.type = 'fnfunc', resource.compartment.id = '<Compartment OCID>'}
Create policy statement for dynamic group platform-agents-dg, that will allow the
resources in the group to invoke tasks in the Data Integration service.
allow dynamic-group platform-agents-dg to use dis-workspaces in compartment sandbox-london
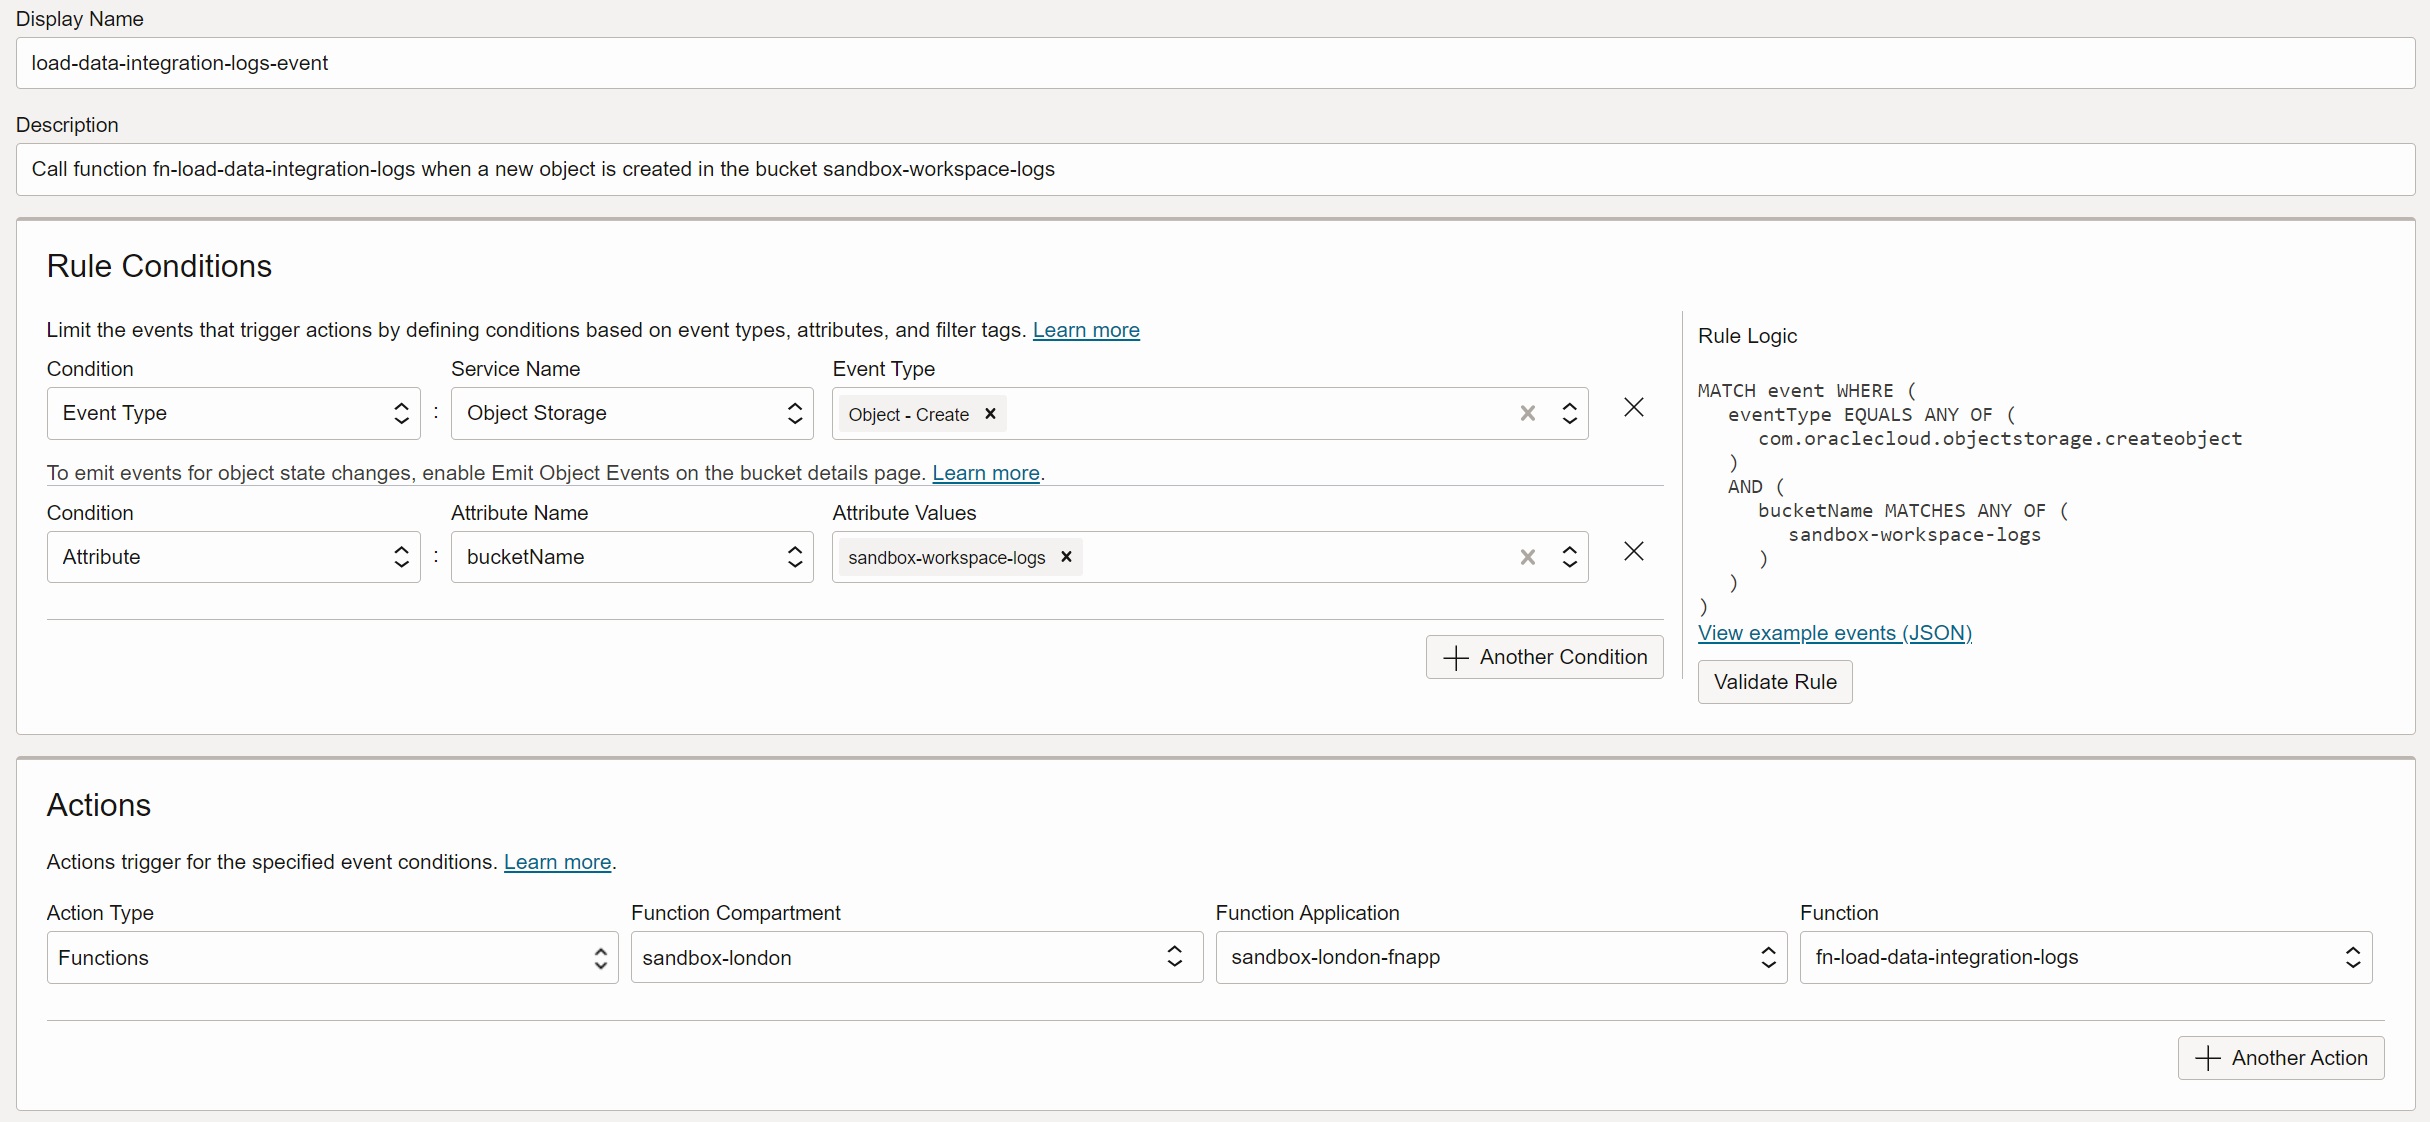
Create Event Rule for Creation of New Objects
Create event rule load-data-integration-logs-event to call function
fn-load-data-integration-logs when a new object is created in the bucket
sandbox-workspace-logs.
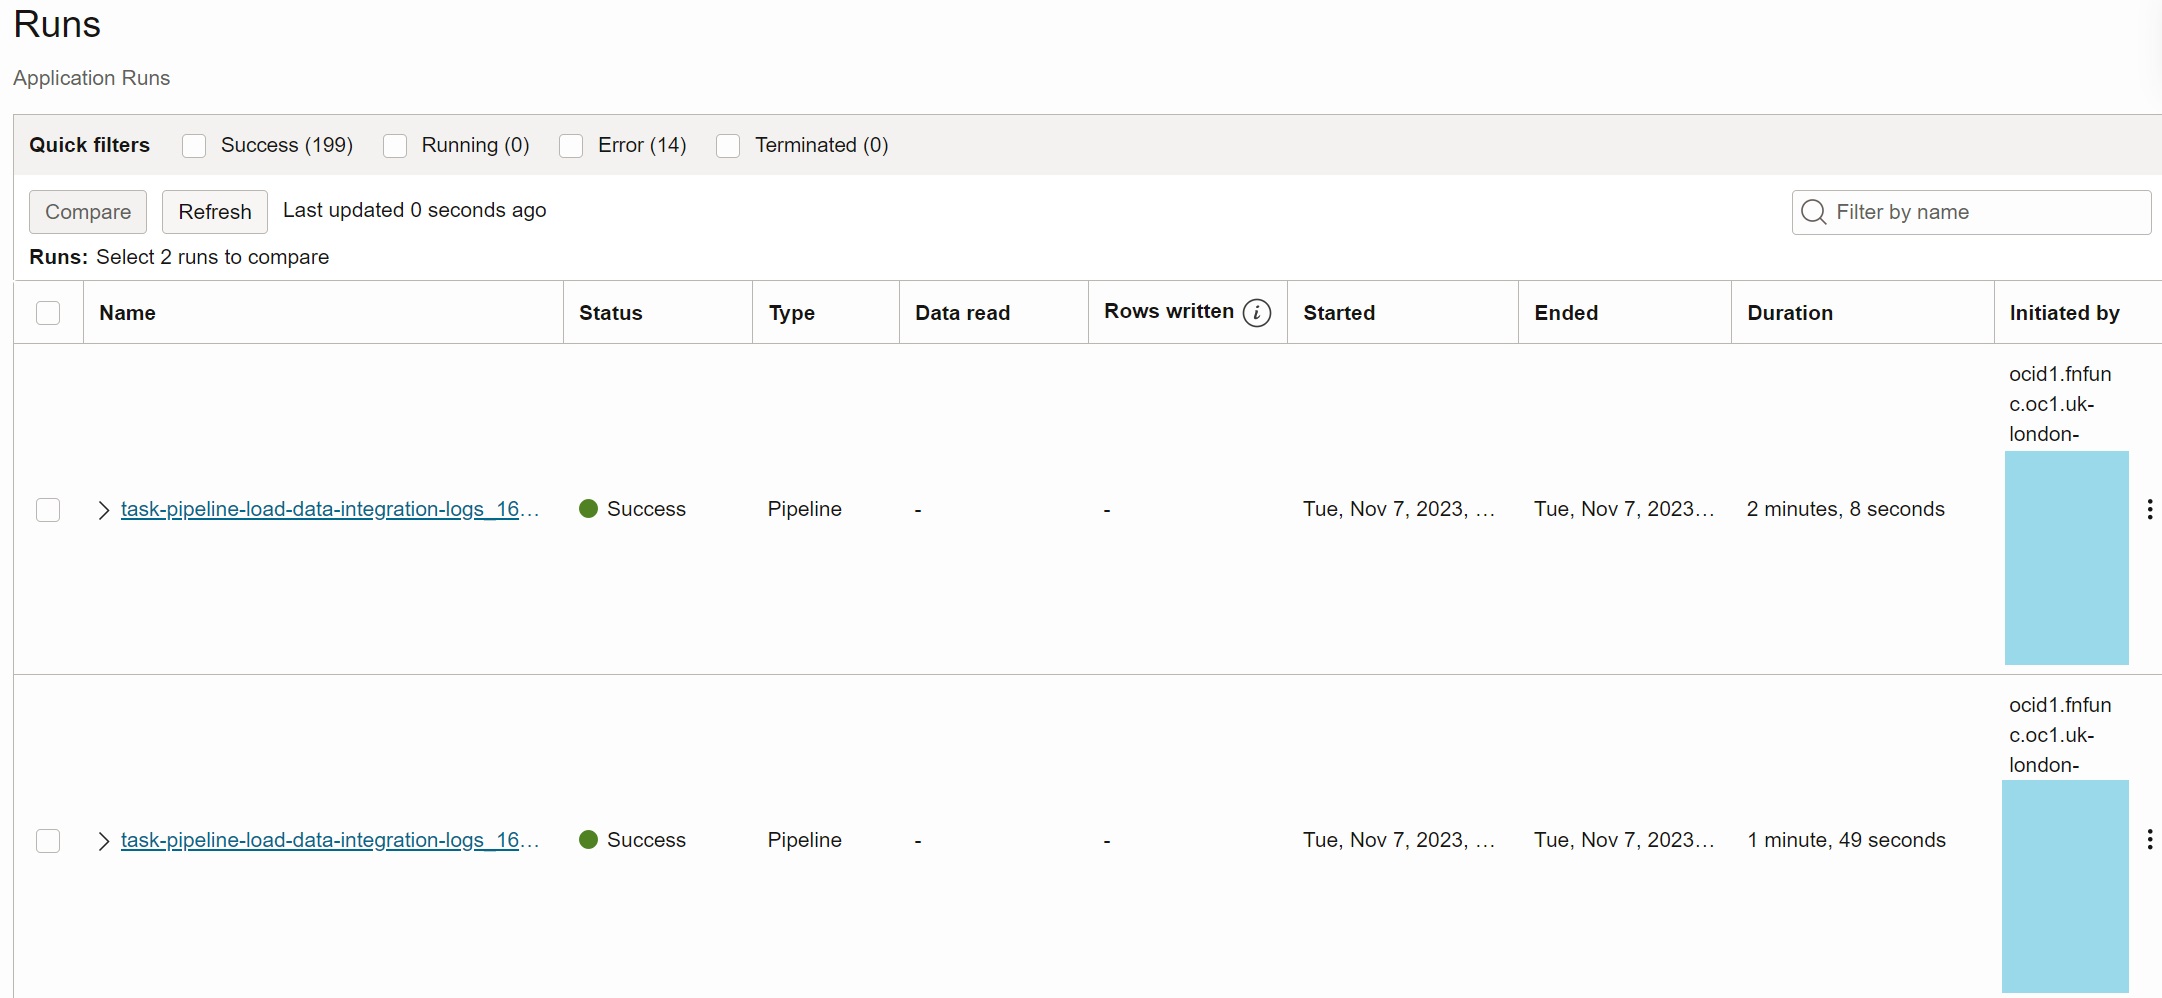
Once the event is created and enabled, any new object in the sandbox-workspace-logs
will trigger invocation of the task pipeline-load-data-integration-logs via Events and
Functions, as you can see in the Initiated By column.
E. Parse, transform, and aggregate logs with Views
Parse Message to Get Parameters and Values
Create view DATA_INTEGRATION_LOGS_PARSED to parse MESSAGE column to retrieve
required information from logs. The parsed information includes task run name, parent task
run name, parameter name, and parameter value. The parsing logic depends on the pattern of
the MESSAGE column.
create or replace view data_integration_logs_parsed as
select
  log_id,
  log_time,
  log_type,
  log_data_object_id,
  log_data_message,
  log_data_workspace_id,
  case
    when log_data_message like 'EXECUTE on TaskRun % - Parameter Name= % ; Value= %' then                        translate(substr(regexp_substr(log_data_message,'EXECUTE on TaskRun [A-Za-z0-9-]+[/ ]'),20),'X/ ','X')
    when log_data_message like 'EXECUTE on TaskRun % - TaskRun Created. Details: Task Key: %Task Name: %' then   translate(substr(regexp_substr(log_data_message,'EXECUTE on TaskRun [A-Za-z0-9-]+[/ ]'),20),'X/ ','X')
    when log_data_message like 'EXECUTE on TaskRun % - SYS.% = %' then                                           translate(substr(regexp_substr(log_data_message,'EXECUTE on TaskRun [A-Za-z0-9-]+[/ ]'),20),'X/ ','X')
  end as parent_task_run,
  case
    when log_data_message like 'EXECUTE on TaskRun % - Parameter Name= % ; Value= %' then                        replace(substr(regexp_substr(log_data_message,'EXECUTE on TaskRun [A-Za-z0-9/-]+ - Parameter'),20),' - Parameter')
    when log_data_message like 'EXECUTE on TaskRun % - TaskRun Created. Details: Task Key: %Task Name: %' then   replace(substr(regexp_substr(log_data_message,'EXECUTE on TaskRun [A-Za-z0-9/-]+ - TaskRun Created'),20),' - TaskRun Created')
    when log_data_message like 'EXECUTE on TaskRun % - SYS.% = %' then                                           replace(substr(regexp_substr(log_data_message,'EXECUTE on TaskRun [A-Za-z0-9/-]+ - SYS'),20),' - SYS')
  end as task_run,
  case
    when log_data_message like 'EXECUTE on TaskRun % - Parameter Name= % ; Value= %' then                        'PARAMETER'
    when log_data_message like 'EXECUTE on TaskRun % - TaskRun Created. Details: Task Key: %Task Name: %' then   'TASK'
    when log_data_message like 'EXECUTE on TaskRun % - SYS.% = %' then                                           'RESULT'
  end as record_type,
  case
    when log_data_message like 'EXECUTE on TaskRun % - Parameter Name= % ; Value= %' then                        replace(substr(regexp_substr(log_data_message,'Parameter Name= [A-Za-z0-9._]+ ; Value='),17),' ; Value=')
    when log_data_message like 'EXECUTE on TaskRun % - TaskRun Created. Details: Task Key: %Task Name: %' then   replace(substr(regexp_substr(log_data_message,'TaskRun Created. Details: Task Key: [A-Za-z0-9-]+ Task Name'),38),' Task Name')
    when log_data_message like 'EXECUTE on TaskRun % - SYS.% = %' then                                           replace(substr(regexp_substr(log_data_message,' - SYS.[A-Za-z0-9_]+ = '),4),' = ')
  end as record_key,
  case
    when log_data_message like 'EXECUTE on TaskRun % - Parameter Name= % ; Value= %' then                        nullif(substr(regexp_substr(log_data_message,'; Value= .+'),10),'null')
    when log_data_message like 'EXECUTE on TaskRun % - TaskRun Created. Details: Task Key: %Task Name: %' then   nullif(substr(regexp_substr(log_data_message,' Task Name: .*'),13),'null')
    when log_data_message like 'EXECUTE on TaskRun % - SYS.% = %' then                                           nullif(substr(regexp_substr(log_data_message,' = .+'),4),'null')
  end as record_value
from data_integration_logs
where log_data_message like 'EXECUTE on TaskRun % - Parameter Name= % ; Value= %'
or log_data_message like 'EXECUTE on TaskRun % - TaskRun Created. Details: Task Key: %Task Name: %'
or log_data_message like 'EXECUTE on TaskRun % - SYS.% = %';
Pivot and Aggregate to Task Runs
The next view DATA_INTEGRATION_TASKS converts parameter values into the target data
types, it pivots parsed logs to required columns, and it aggregates them on the level of
task runs.
create or replace view data_integration_tasks as
select
  task_run,
  min(case when record_type = 'TASK' then record_value end) as task_name,
  min(case when record_type = 'PARAMETER' and record_key = 'SYS.TASK_RUN_NAME' then record_value end) as task_run_name,
  min(case when record_type = 'PARAMETER' and record_key = 'SYS.TASK_RUN_KEY' then record_value end) as task_run_key,
  min(case when record_type = 'PARAMETER' and (record_key = 'SYS.PARENT_TASK_RUN_NAME' or (record_key = 'SYS.TASK_RUN_NAME' and task_run = parent_task_run)) then record_value end) as parent_task_run_name,
  min(case when record_type = 'PARAMETER' and (record_key = 'SYS.PARENT_TASK_RUN_KEY'  or (record_key = 'SYS.TASK_RUN_KEY' and task_run = parent_task_run)) then record_value end) as parent_task_run_key,
  min(case when record_type = 'PARAMETER' and record_key = 'SYS.TASK_START_TIME' then to_timestamp_tz(record_value,'DY Mon DD HH24:MI:SS TZD YYYY') end) as task_start_time,
  min(log_time) as task_min_log_time,
  max(log_time) as task_max_log_time,
  min(case when record_type = 'RESULT' and record_key = 'SYS.STATUS' then record_value end) as status,
  min(case when record_type = 'RESULT' and record_key = 'SYS.START_TIME_TIMESTAMP' then to_timestamp(record_value,'YYYY-MM-DD HH24:MI:SS.FF3') end) as start_time_timestamp,
  min(case when record_type = 'RESULT' and record_key = 'SYS.END_TIME_TIMESTAMP' then to_timestamp(record_value,'YYYY-MM-DD HH24:MI:SS.FF3') end) as end_time_timestamp,
  min(case when record_type = 'RESULT' and record_key = 'SYS.DURATION' then to_number(record_value)/1000 end) as duration_sec,
  min(case when record_type = 'RESULT' and record_key = 'SYS.NO_OF_INSERTS' then to_number(record_value) end) as no_of_inserts,
  min(case when record_type = 'RESULT' and record_key = 'SYS.DATA_WRITTEN' then to_number(record_value) end) as data_written_bytes,
  min(case when record_type = 'RESULT' and record_key = 'SYS.DATA_READ' then to_number(record_value) end) as data_read_bytes
from data_integration_logs_parsed
group by task_run;
Aggregate to Parent Level
Finally, the top level view DATA_INTEGRATION_SUMMARY aggregates task runs to the
parent (pipeline) level. It summarizes duration, number of inserts, and read and written
bytes from individual tasks. It also calculates elapsed duration as the difference between
the last and the first log records. If status of any task is not SUCCESS, the parent
status is marked as ERROR.
create or replace view data_integration_summary as
with aggregated_tasks as (
select
  parent_task_run_name as task_run_name,
  parent_task_run_key as task_run_key,
  sum(case when status = 'SUCCESS' then 1 else 0 end) as task_success_count,
  sum(case when status <> 'SUCCESS' then 1 else 0 end) as task_error_count,
  min(case when task_run_key = parent_task_run_key then task_name else null end) as task_name,
  min(task_min_log_time) as task_min_log_time,
  max(task_max_log_time) as task_max_log_time,
  min(start_time_timestamp) as start_time_timestamp,
  max(end_time_timestamp) as end_time_timestamp,
  sum(duration_sec) as aggregated_duration_sec,
  sum(no_of_inserts) as aggregated_no_of_inserts,
  sum(data_written_bytes) as aggregated_data_written_bytes,
  sum(data_read_bytes) as aggregated_data_read_bytes
from data_integration_tasks
group by
  parent_task_run_name,
  parent_task_run_key
)
select
  task_name,
  task_run_name,
  task_run_key,
  case when task_error_count = 0 then 'SUCCESS' else 'ERROR' end as status,
  task_success_count,
  task_error_count,
  task_min_log_time,
  task_max_log_time,
  start_time_timestamp,
  end_time_timestamp,
  extract(day from task_max_log_time-task_min_log_time)*24*60*60+
    extract(hour from task_max_log_time-task_min_log_time)*60*60+
    extract(minute from task_max_log_time-task_min_log_time)*60+
    extract(second from task_max_log_time-task_min_log_time) as elapsed_duration_sec,
  aggregated_duration_sec,
  aggregated_no_of_inserts,
  aggregated_data_written_bytes,
  aggregated_data_read_bytes
from aggregated_tasks;
F. Analyze task runs in Oracle Analytics Cloud
Create Data Set
To analyze data in Oracle Analytics Cloud, define a data set Data Integration Summary
based on the database view DATA_INTEGRATION_SUMMARY.
Build Dashboard
The final step is to build visualizations from Data Integration Summary data set.
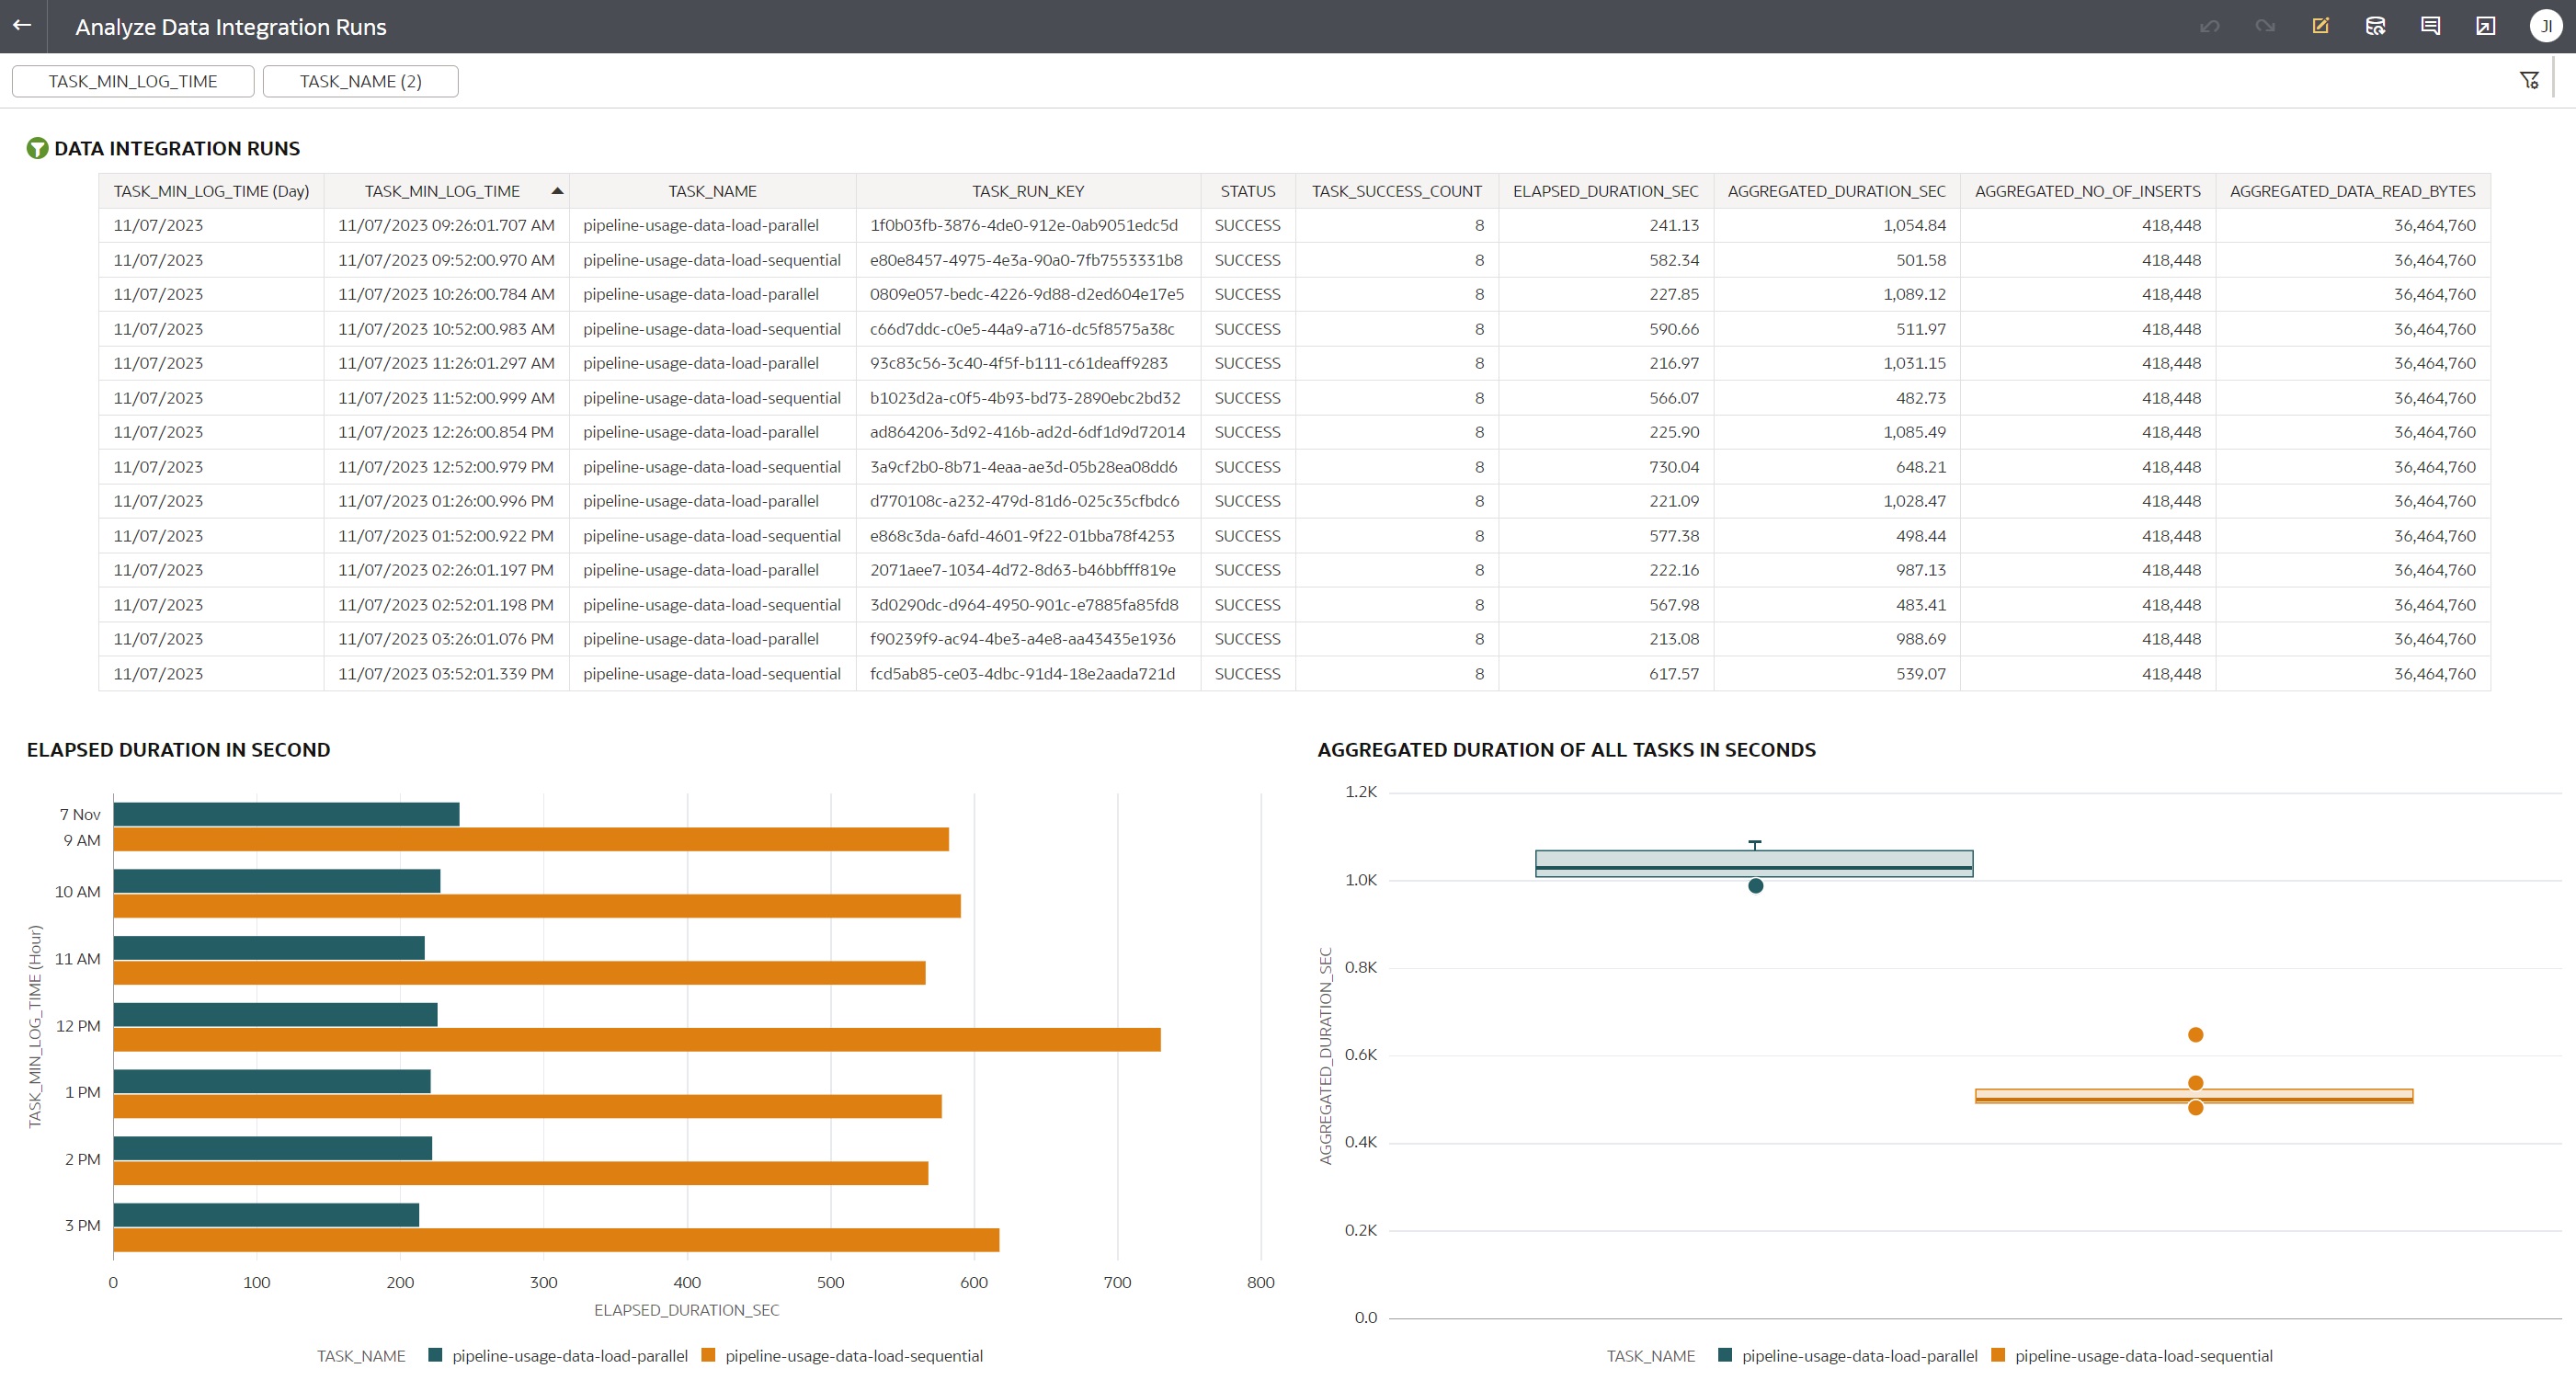
Below is an example of the Analyze Data Integration Runs workbook, which shows
parameterized list of parent tasks, horizontal bar graph with elapsed duration of parent
tasks, and boxplot graph showing average and median aggregated duration of tasks.
Summary
Building a data pipeline and analytics for Data Integration runtime metadata can provide interesting insights into the behavior of your Data Integration tasks. You can use the insights to optimize the tasks, monitor the executions, do capacity planning, or provide a consolidated view across all workspaces and applications.
The described pipeline uses a built-in integration between various OCI services - Data Integration, Logging, Connector Hub, Object Storage, Events, and Functions. With Logging as the data source of runtime metadata, the runtime logs are available as soon as a task is running. Connector Hub batches the logs though, so even if you decrease the batch time, the final latency will be in minutes and not in seconds. However, for most analytics this is more than enough.
The business logic transforming the logs into useful information is provided in the database views. Note the same logic could be easily implemented in the Data Integration data flows, however I used views in order to immediately see the results of relatively complex transformations. The logic itself is the main caveat of this solution - the messages are not documented and if their structure changes, the views will be invalidated.
Another caveat is that runtime logs do not contain all the information I would like to analyze. For example type of the task (data flow, SQL, data loader, etc.) is not available in logs. Also, I did not find a way how to find out in which application the task is. Production solution therefore might require augmenting the runtime logs with information retrieved via API calls.
Last but not least, you can use this post as an inspiration for other pipelines and analytics based on log data. Integrated services like Logging, Connector Hub, Events, Functions, ADW, and Oracle Analytics Cloud may be used for vast variety of other use cases.
Resources
- Data Integration documentation is available here: Data Integration Overview.
- Logging documentation is available here: Logging Overview.
- Documentation on enabling Logging for Data Integration: Enabling Logs in Oracle Cloud Infrastructure Logging.
- Functions documentation is available here: Functions Overview
- Events documentation is available here: Events Overview
- Blog post explaining how to invoke Data Integration tasks via API: Event Driven Automation of OCI Data Integration Tasks.